
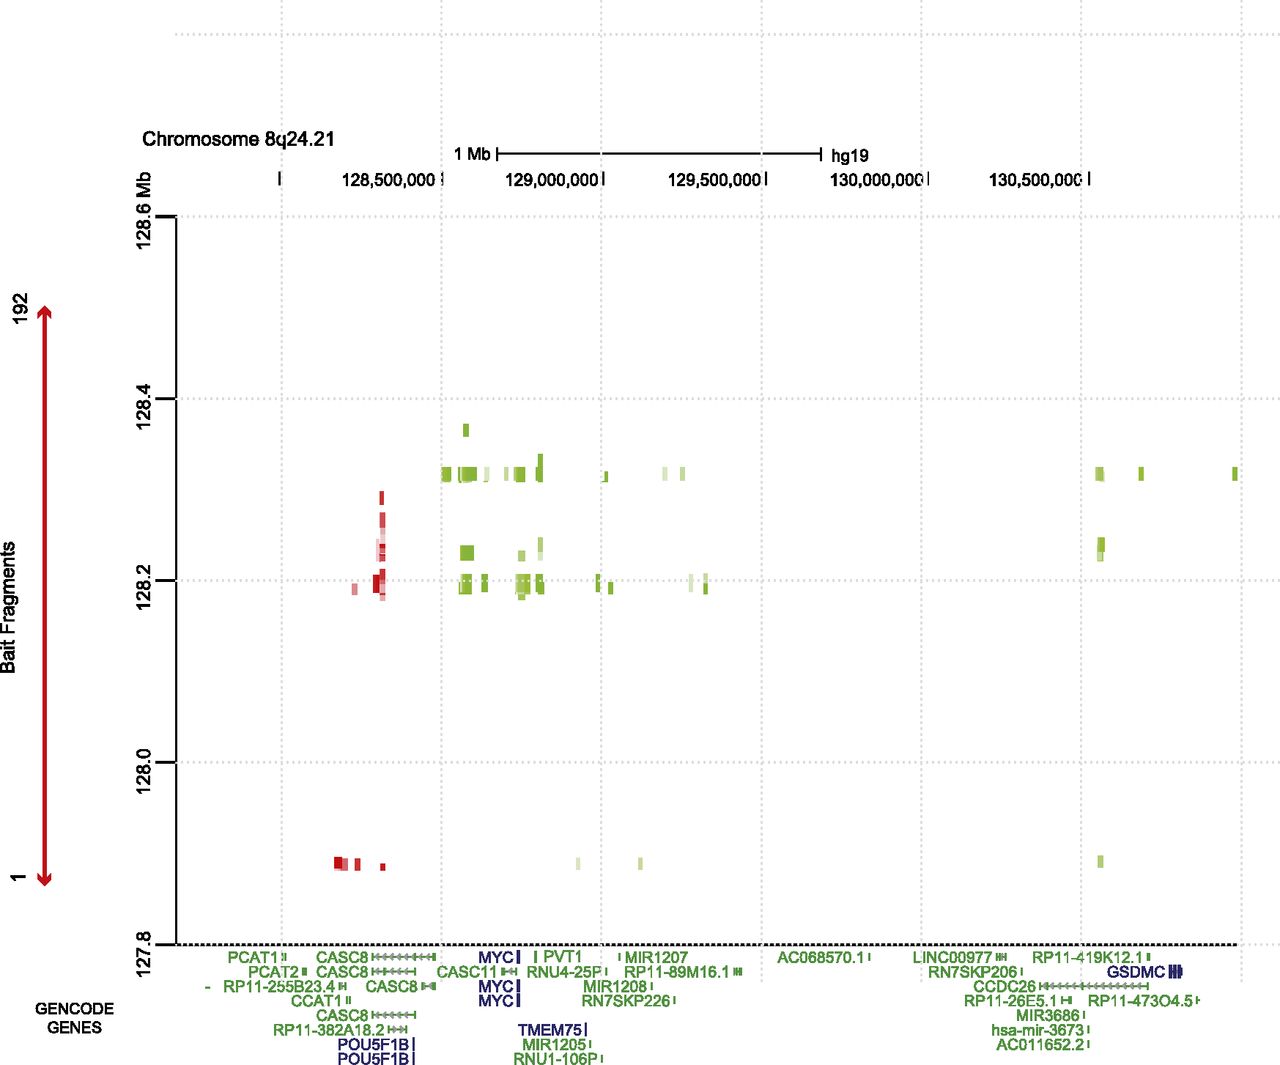
Two-way heatmap of interaction peaks at the 8q24.21 locus. Two-way heatmap of interaction peaks between bait fragments within the 8q24.21 capture region and target fragments either side of the capture region (green) or between two bait fragments within the capture region (red) for the GM06990 libraries. The genomic locations of the bait fragments are shown on the y-axis. The genomic locations of the target fragments, aligned with GENCODE genes, are shown on the x-axis. The color intensity of each square represents the statistical significance of the interaction from dark green/red (P = 1 × 10⁻¹⁰) to light green/red (P ≤ 0.01). Interactions with a false discovery corrected P-value of >0.01 are not shown.


