
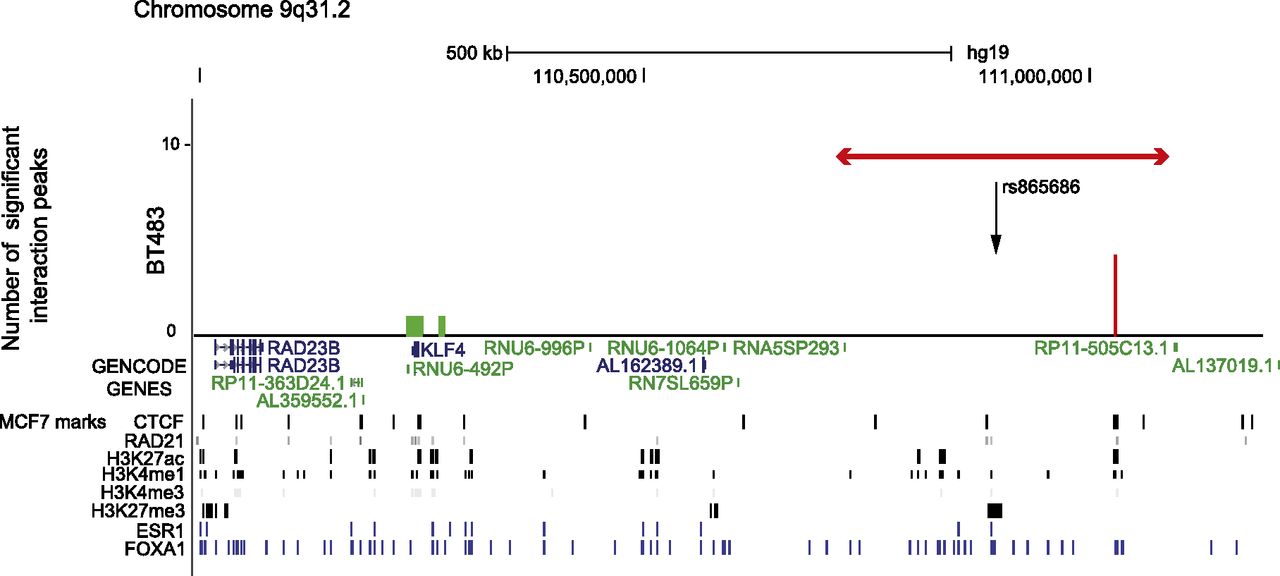
Statistically significant CHi-C interaction peaks at the 9q31.2 locus. The number of statistically significant interaction peaks mapping to each HindIII fragment (y-axis) is plotted against the genomic location of the HindIII fragment (x-axis) for a 1.2-Mb region (110.2–111.0 Mb) of chromosome 9q31.2, including the 0.3-Mb genomic region (110,759,922–111,097,304 bp) that was targeted in the sequence capture step of our CHi-C protocol. All coordinates are based on hg19. The capture region is denoted by a double-headed red arrow; the “bait end” of the interaction peaks is indicated in red; the target end is indicated in green. The significant interaction peaks are aligned with (1) GENCODE genes (v19) with protein-coding transcripts colored blue and noncoding transcripts colored green; and (2) CTCF and RAD21 binding sites, active (H3K27ac, H3K4me1, and H3K4me3) and repressive (H3K27me3) histone modification marks (in black), and ESR1 and FOXA1 binding sites (in blue) generated in the breast cancer cell line MCF7 by the ENCODE Project, Frietze et al. (2012), and Hurtado et al. (2011).


