
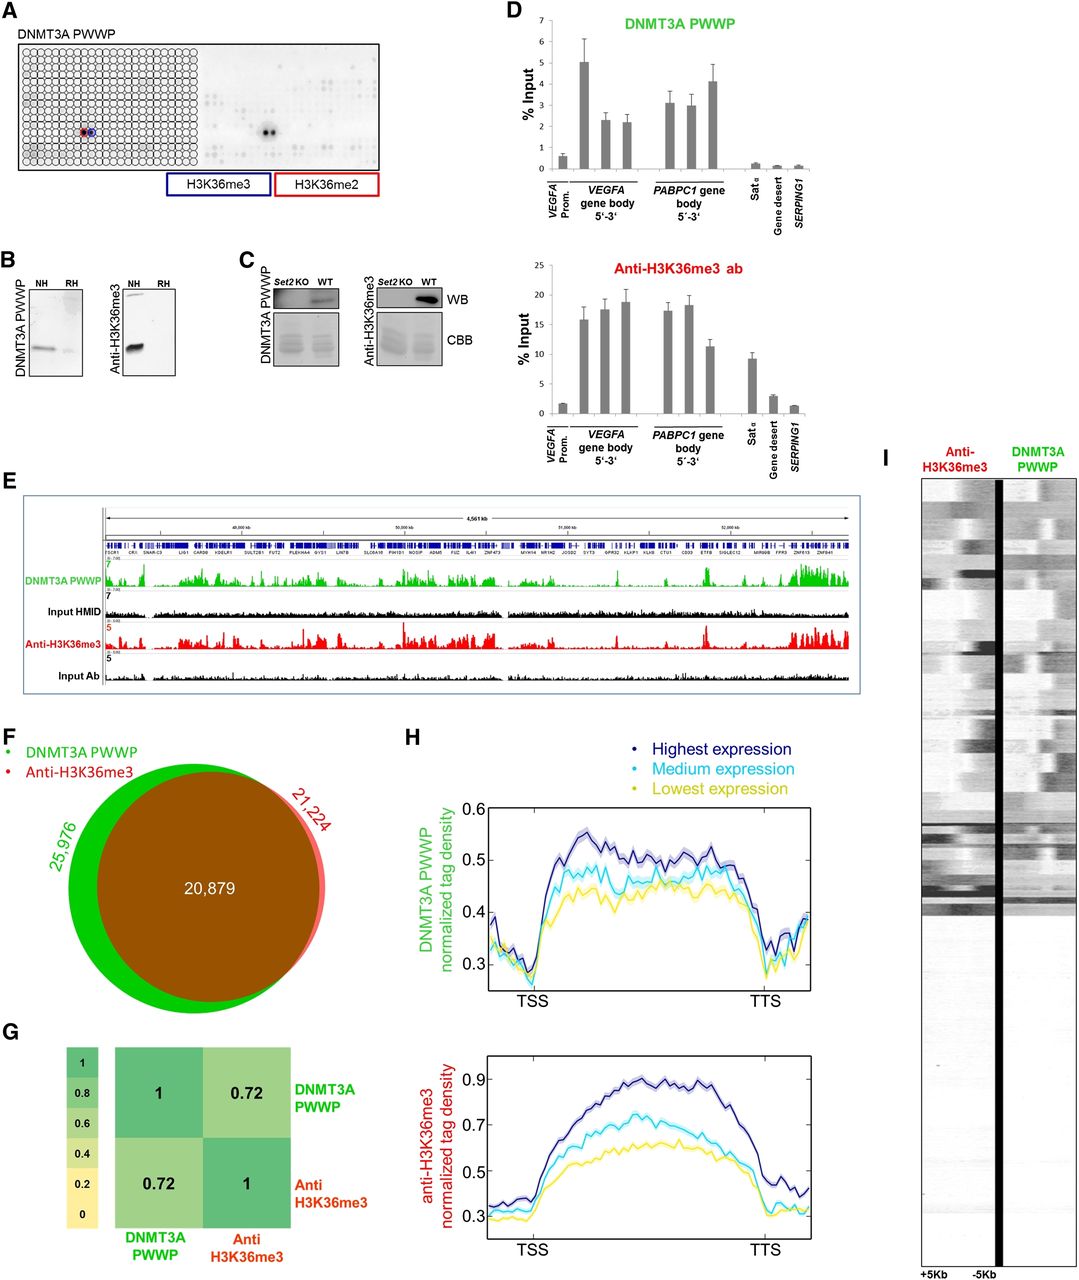
Comparative analysis of results obtained with the DNMT3A PWWP domain and anti-H3K36me3 antibody. (A) Peptide array analysis of the specificity of DNMT3A PWWP. For comparison with anti-H3K36me3 antibodies, refer to Figure 1. (B) Western blot analysis using DNMT3A PWWP and anti-H3K36me3 antibody (Lot 2 from Fig. 1) with native (NH) and recombinant histones (RH). (C) Western blot (WB) analysis using DNMT3A PWWP and anti-H3K36me3 antibody (Lot 3 from Fig. 1) with native histones isolated from wild-type and set2 KO S. cerevisiae. The Coomassie brilliant blue (CBB)-stained gel after transfer is shown as a loading control. (D) Comparison of CIDOP-qPCR and ChIP-qPCR results obtained with the DNMT3A PWWP domain and anti-H3K36me3 antibody (Lot 2) using amplicons associated with H3K27me3, H3K9me3, and the gene bodies of VEGFA and PABPC1. All experiments were carried out in triplicates of biological duplicates. Error bars represent the standard errors of the mean. (E) Representative genome browser snapshot comparing CIDOP-seq and ChIP-seq results obtained with the DNMT3A PWWP domain and anti-H3K36me3 antibody (ENCODE). For more examples, refer to Supplemental Figure S10. (F) Venn diagram of the overlap of peak regions between DNMT3A PWWP domain and anti-H3K36me3 antibody. (G) Spearman correlation coefficient heatmap of CIDOP-seq and ChIP-seq tags in 15-kb bins. (H) Metagene profiles of DNMT3A PWWP and anti-H3K36me3 antibody ranked by differential expression. The shaded lines represent the standard errors of the mean. Supplemental Figure S5D shows this image with the y-axis scale starting from 0. (I) Clustering analysis of tag densities from the DNMT3A PWWP and anti-H3K36me3 antibody CIDOP-seq and ChIP-seq data sets. Tags were collected within a 10-kb window around TSS and sorted by k-means clustering (50 clusters). The clusters with low DNMT3A PWWP and anti-H3K36me3 signals also lack H3K4me3 and likely are not expressed (not shown).


