
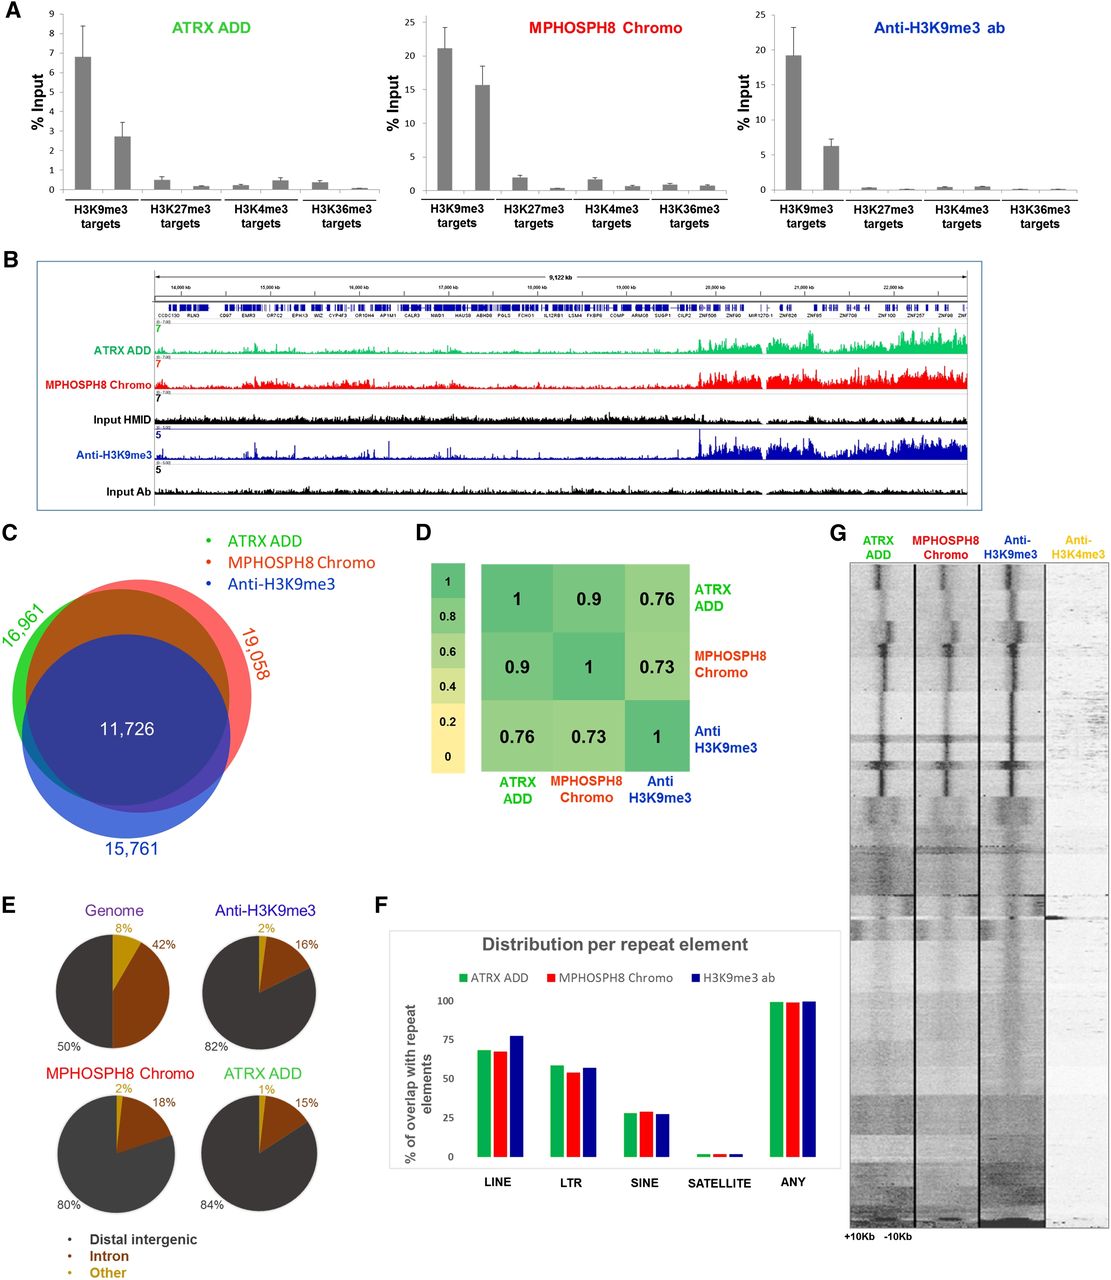
CIDOP and ChIP of ATRX ADD, MPHOSPH8 Chromo, and anti-H3K9me3 antibody. (A) Comparison of CIDOP-qPCR and ChIP-qPCR signals with domains and anti-H3K9me3 antibody (Lot 2 from Fig. 1) using amplicons associated with H3K9me3, H3K27me3, H3K4me3, and H3K36me3. All experiments were carried out in triplicates of biological duplicates. Error bars represent the standard errors of the mean. (B) Representative genome browser snapshot comparing CIDOP-seq and ChIP-seq signals of domains and anti-H3K9me3 antibody (taken from ENCODE). For more examples, refer to Supplemental Figures S7A, S8A, and S8C. (C) Venn diagram of the overlap of peak regions between domains and anti-H3K9me3 antibody. The number of peaks in each area is given in Supplemental Table S3. (D) Spearman correlation coefficient heatmap of CIDOP-seq and ChIP-seq tags in 15-kb bins. (E) Distribution of CIDOP-seq and ChIP-seq peaks among different genomic elements. (F) Distribution of CIDOP-seq and ChIP-seq peaks among different repeat elements (cf. Supplemental Fig. S4E). (G) Clustering analysis of tag densities from MPHOSPH8 Chromo and ATRX ADD CIDOP-seq as well as anti-H3K9me3 and H3K4me3 antibody ChIP-seq data sets. Tags were collected within a 20-kb window, centered on the midpoints of anti-H3K9me3 antibody peaks, and sorted by k-means clustering (30 clusters). An analysis with 100 clusters is shown in Supplemental Figure S4F.


