
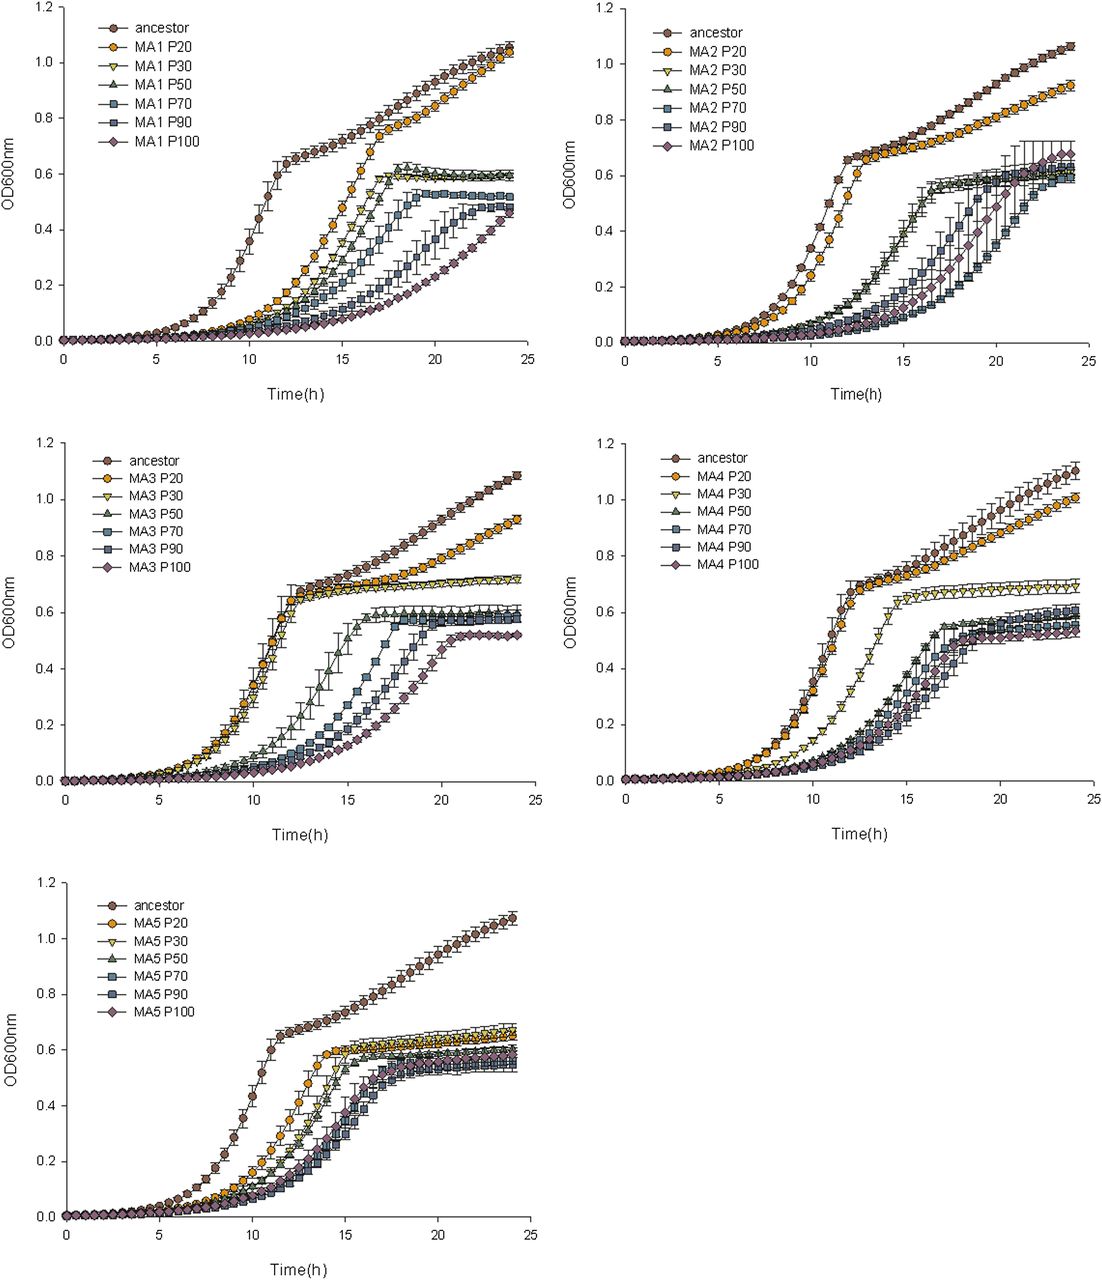
Figure 3.
Saccharomyces cerevisiae fitness declines along the evolution experiment. We represent the growth curves for six isolated colonies at different passages (p20, p30, p50, p70, p90, and p100) for each of the five independently evolved lines of S. cerevisiae (MA1 to MA5). Growth was measured using absorbance at 600 nm.


