
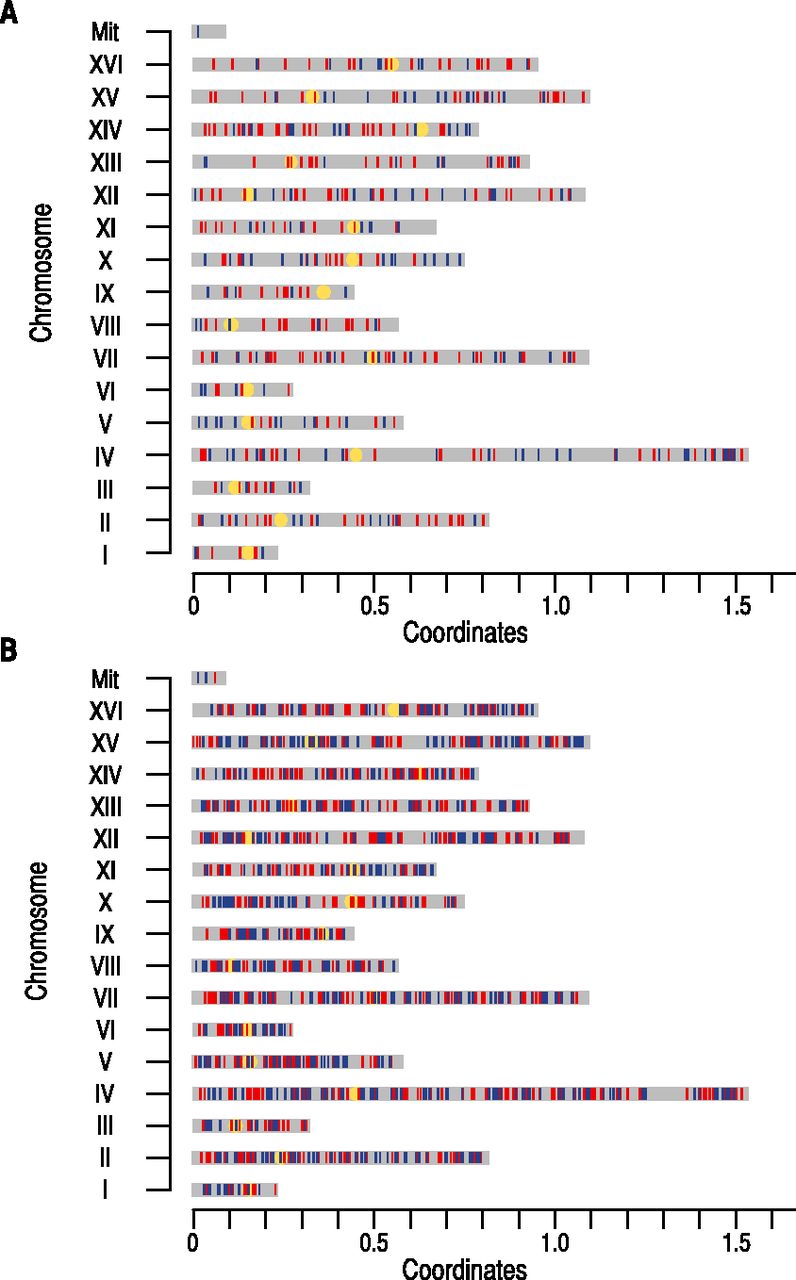
Figure 2.
Genome-wide distribution of single nucleotide polymorphisms (SNPs) along the experimental evolution of Saccharomyces cerevisiae in singletons (blue vertical lines) and duplicates (red vertical lines). (A) Distribution of nonsynonymous SNPs (NSNPs) in protein coding regions of singletons and duplicates in the 16 S. cerevisiae chromosomes (chromosomes I to XVI). (B) Distribution of SNPs in the promoter regions of singletons and duplicates. Yellow circles refer to the chromosomal centromere. We also represent mutations in mitochondria (Mit).


