
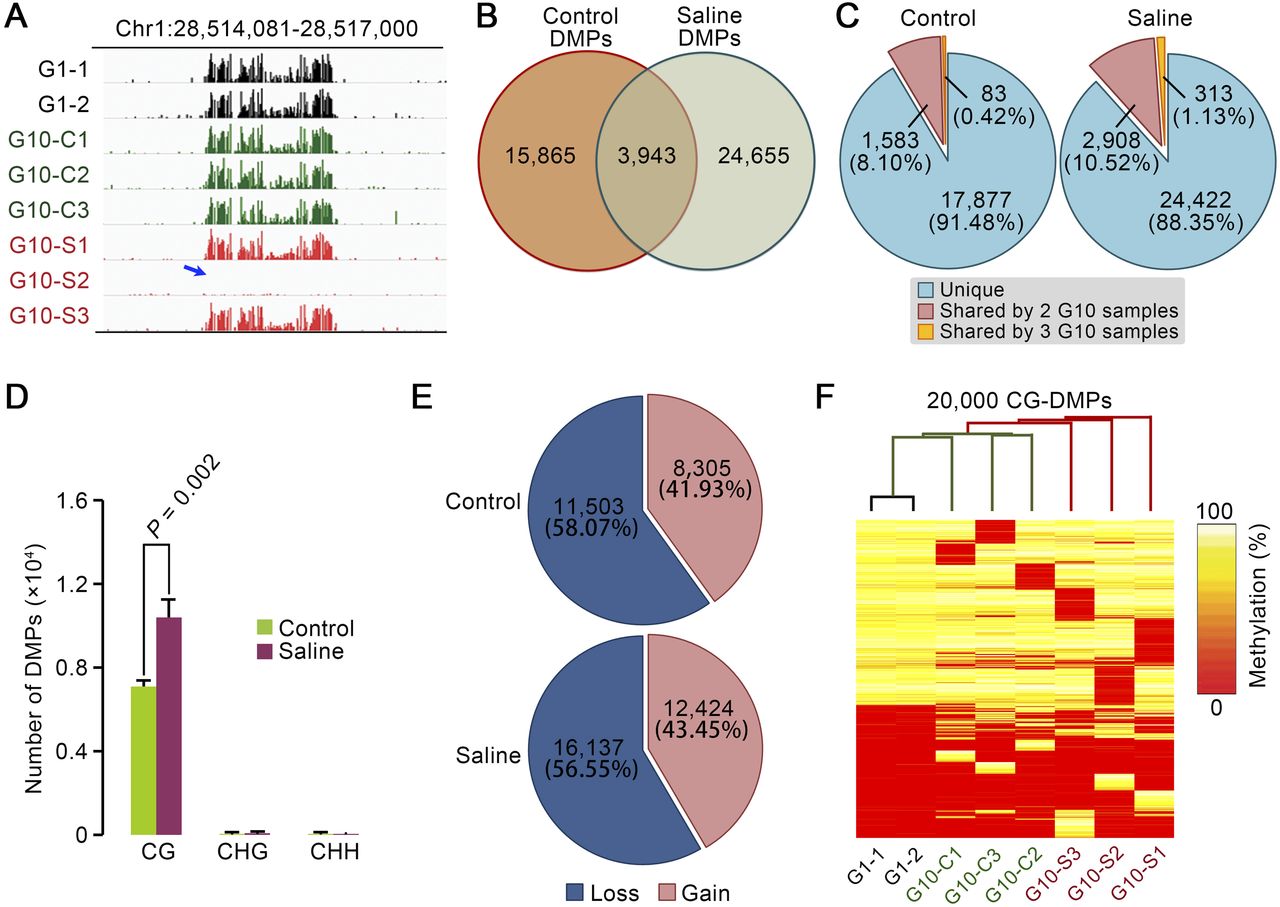
Multigenerational propagation on saline soil increases the accumulation of differentially methylated CG positions (CG-DMPs) in MA lineages. (A) IGV (Integrated Genome Viewer) (see Methods) views of methylation level differentials. Column height indicates the relative extent of methylation at individual cytosine positions in G1 (black), saline soil G10 (red), and control G10 (green) genome samples on a specific region of chromosome 1. The blue arrow indicates a cluster of differentially methylated cytosine positions (DMPs) where methylation has been lost in sample G10-S2. (B) Number and overlap of DMPs detected in G10 control (Control DMPs) and saline soil (Saline DMPs) samples. (C) Frequency of DMP sharing within control (Control) versus saline soil (Saline) treatments. “Shared” refers to DMPs shared within (rather than between) treatments (Control or Saline). (D) Comparison of the number of DMPs at CG, CHG, and CHH sites in G10 saline soil (Saline) and control samples. Results shown are means ±SD. (E) Percentages of DMPs due to loss or gain of methylation in G10 samples. Data from each group (Control or Saline soil) were combined. (F) Hierarchical clustering of samples based on selected sets of 20,000 sites drawn randomly from CG-DMPs identified in all samples.


