
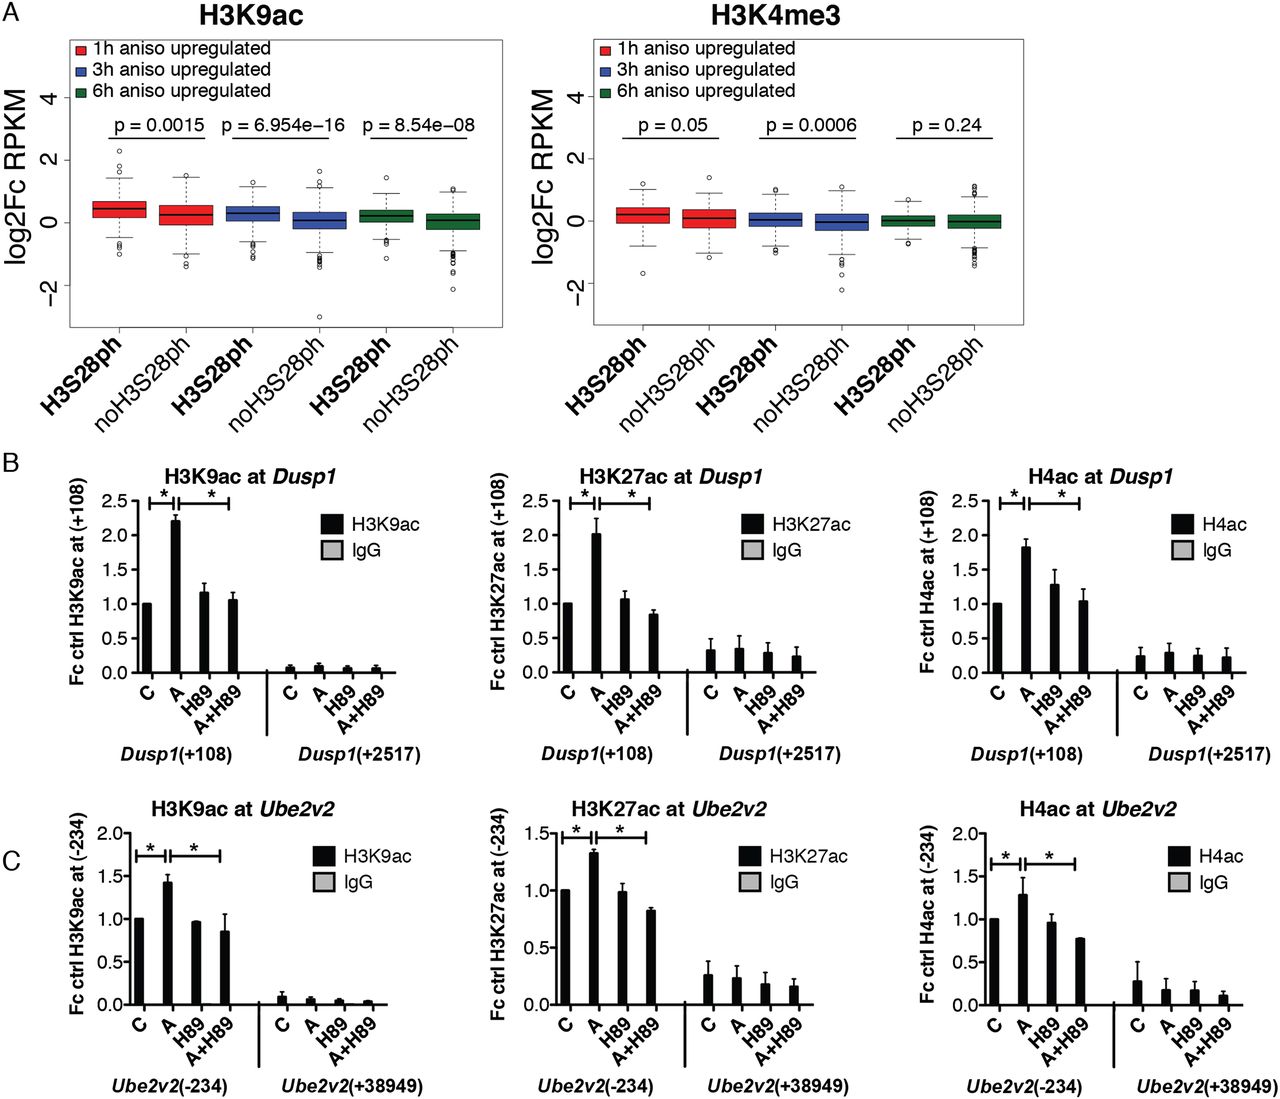
H3S28ph-marked genes show higher increase in histone acetylation levels upon 1 h of anisomycin stimulation. (A) Boxplots showing log2 fold change in normalized read counts (RPKM) for H3K9ac and H3K4me3 ChIP-seq after 1 h of treatment with anisomycin at 1hA, 3hA, and 6hA targets. Fold change was calculated as the ratio of RPKM in anisomycin condition to RPKM in the control state at the regions from −1 kb to +3 kb surrounding the TSS. P-values were determined by the Mann-Whitney U test. (B,C) ChIP-qPCR analysis of H3K9ac, H3K27ac, and H4ac levels at Dusp1 and Ube2v2 genes in control (C) and anisomycin-treated cells (A) in the absence and presence of H89. Error bars represent SDs (n = 3). (*) P < 0.05.


