
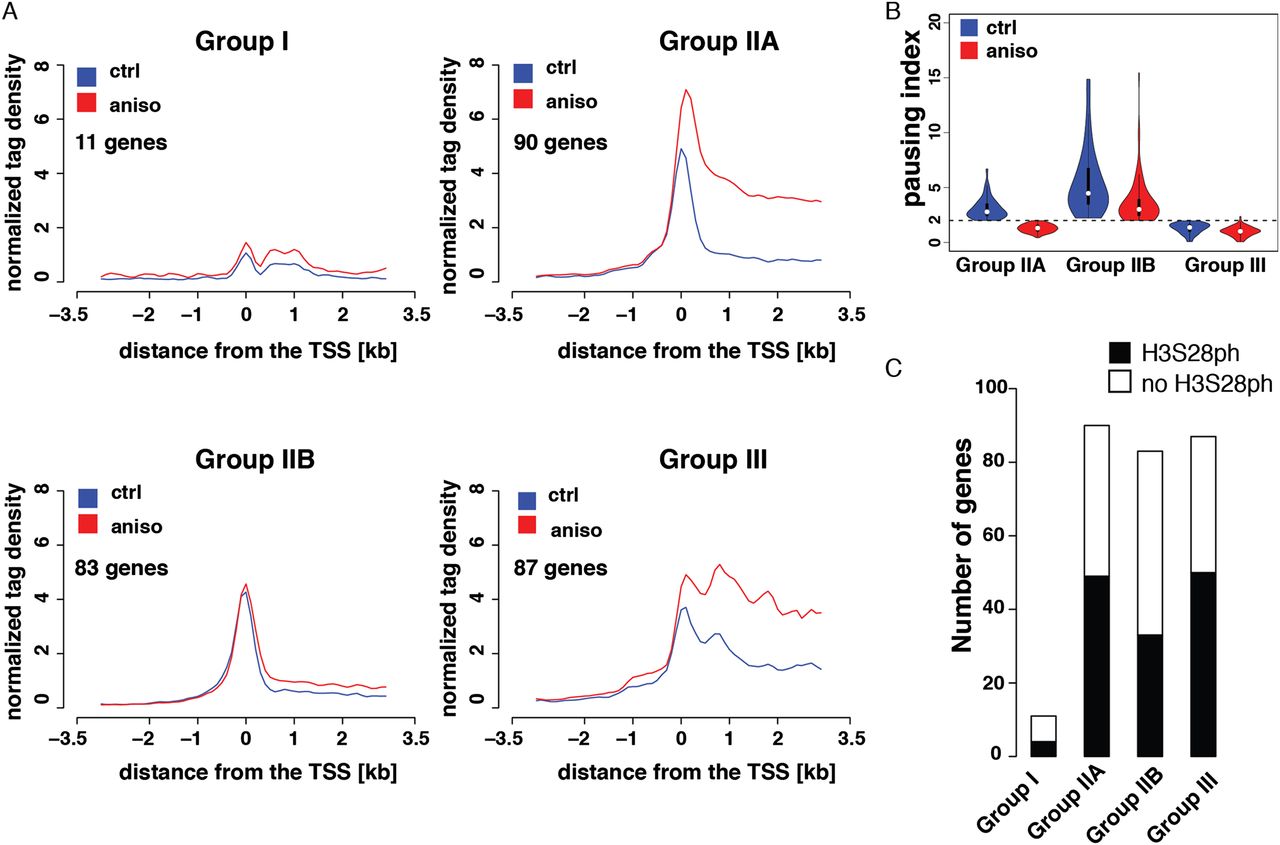
Figure 4.
Classification of stress-induced genes. (A) Normalized RNAPIIS5ph ChIP-seq tag density profiles of untreated (blue line) and stress-induced (red line) serum-deprived mouse Swiss 3T3 fibroblasts. The genes are divided into four groups according to their pausing indices and the presence of scRNA. (B) Violin plots showing the distribution of pausing indices among groups of genes associated with different RNAPII profiles. (C) Histogram showing the distribution of H3S28ph-marked genes among different regulatory groups. None of the groups is significantly enriched in H3S28ph marked genes (P-value = 0.07, Fisher’s exact test).


