
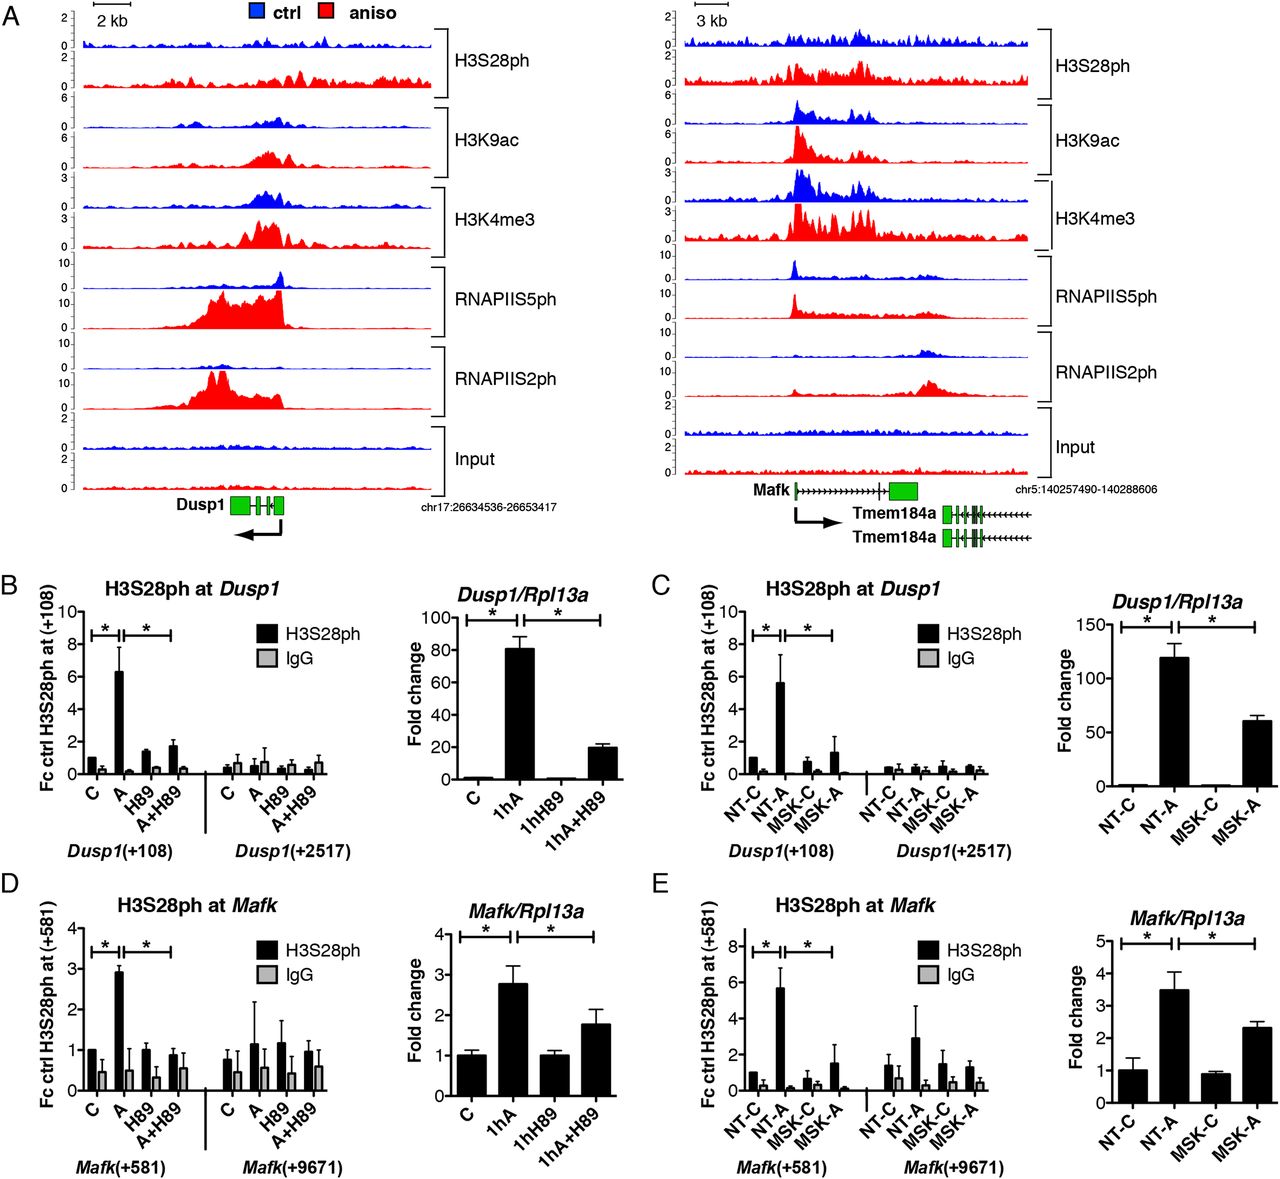
Stress-induced deposition of H3S28ph is dependent on MSK1/2 activity. (A) Genome browser representations of H3S28ph, H3K9ac, H3K4me3, RNAPIIS5ph, and RNAPIIS2ph normalized tag density profiles of representative genes (Dusp1 and Mafk) up-regulated after 1 h of treatment with anisomycin. The profiles derived from untreated cells are depicted in blue and profiles of cells under stress-induced conditions are shown in red. (B,D) ChIP-qPCR analysis of stress-induced H3S28ph levels upon MSK1/2 inhibition with H89 at Dusp1 and Mafk genes (left panels); and RT-qPCR analysis of mRNA expression of Dusp1 and Mafk genes (right panels) in control (C) and anisomycin-treated cells (A) in the absence or presence of H89. Error bars represent SDs (n = 3). (*) P < 0.05. (C,E) ChIP-qPCR analysis of stress-induced H3S28ph in knockdown control (NT) and Rpska5 knockdown (MSK) cells at Dusp1 and Mafk genes (left panels); and RT-qPCR analysis of mRNA expression of Dusp1 and Mafk genes (right panels) upon anisomycin treatment in knockdown control (NT) and Rpska5 knockdown (MSK) cells. Error bars represent SDs (n = 3). (*) P < 0.05. Knockdown efficiency is shown in Supplemental Figure 10B–D.


