
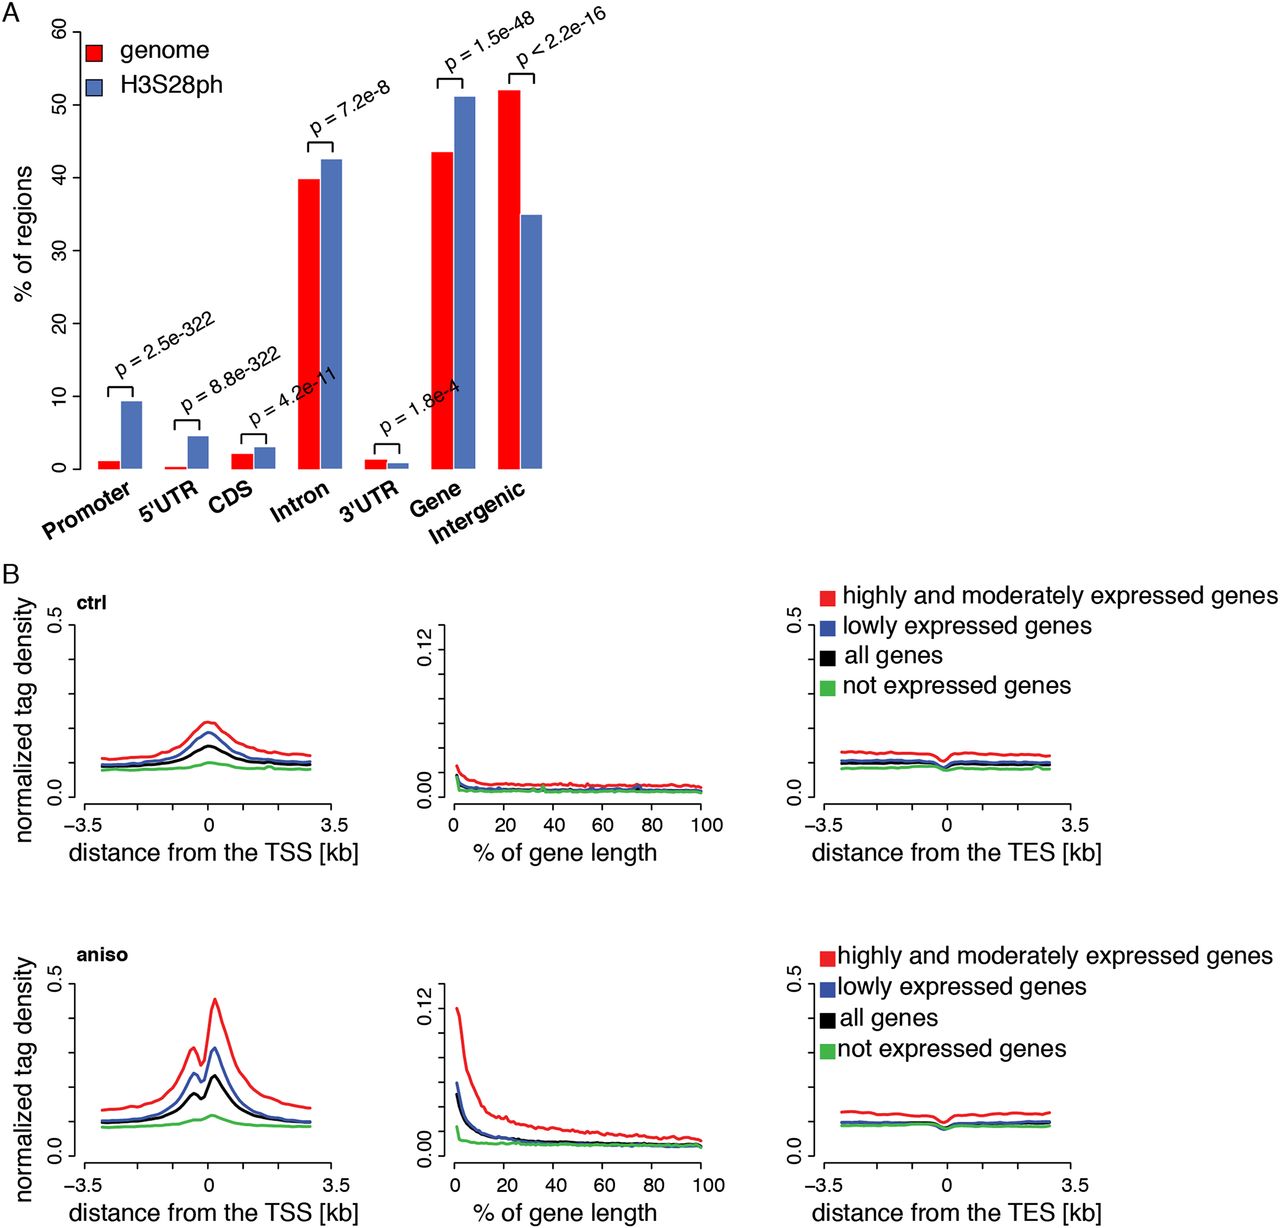
Stress-induced H3S28ph targets active promoters. (A) Enrichment of H3S28ph ChIP-seq regions over six gene features compared with the genome background. “Promoter” is defined as the region located within 1 kb upstream of the annotated transcription start site (TSS). “CDS” refers to the coding sequence. “Gene” consists of 5′UTR, coding exons, introns, and 3′UTR. “Intergenic” refers to all regions located outside of genes extended by 1 kb from both gene ends. The significance of the observed enrichment was determined by a one-sided binomial test. (B) Average density plots of normalized H3S28ph ChIP-seq tags centered at transcription start sites (TSS, left panel), transcription end sites (TES, right panel) for a control (ctrl), and stress-induced state (aniso). (Middle panel) The metagene profile of H3S28ph ChIP-seq densities. The genes are grouped according to their expression level: highly and moderately expressed (in red; ctrl: 3429 genes, aniso: 3181 genes), lowly expressed (in blue; ctrl: 7271 genes, aniso: 7369 genes), and not expressed (in green; ctrl: 10,908 genes, aniso: 11,059 genes). The average profile derived from all genes is depicted in black. The classification of the genes is based on mRNA-seq data (see Supplemental Methods and Supplemental Fig. 4B).


