
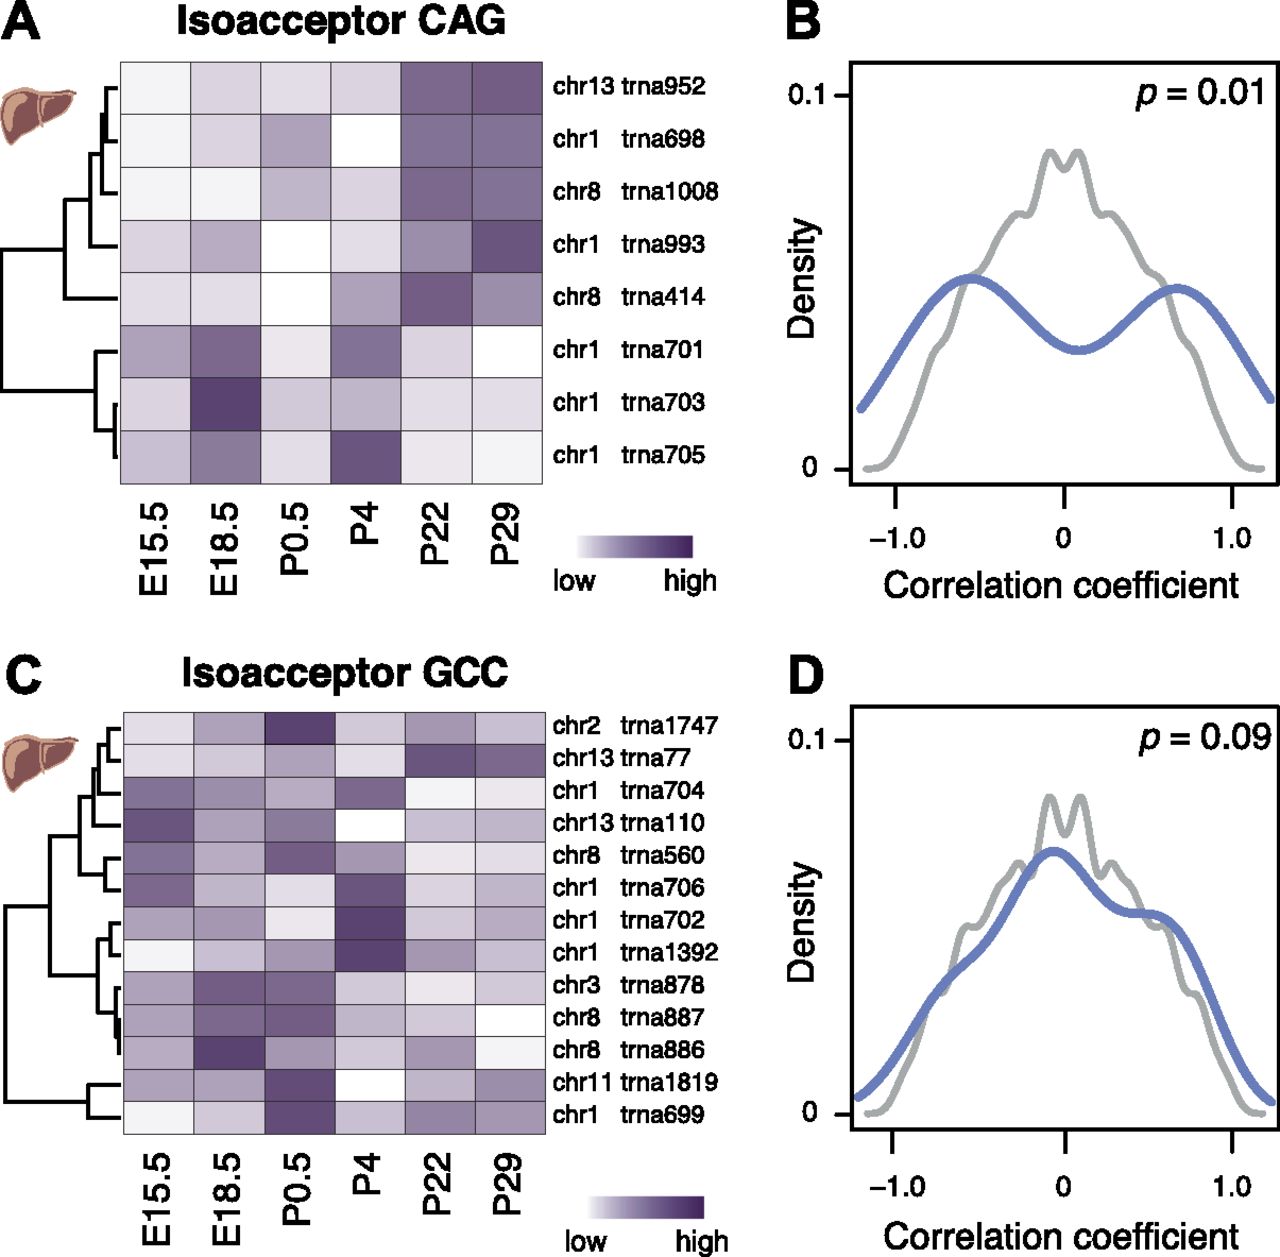
tRNA gene expression is compensated on the isoacceptor level during mouse development. Anticodon isoacceptor Leu(CAG) (A) and Gly(GCC) (C) illustrate a strong and weak correlation of tRNA gene expression level, respectively. Each row of the heatmap represents relative expression levels of tRNA genes across different developing mouse liver stages (white, low = 0; purple, high = 1). Density plots (B,D) represent the distribution of pairwise correlation coefficients between each tRNA gene’s expression levels during mouse liver development for anticodon isoacceptor (B) Leu(CAG) and (D) Gly(GCC) (blue). Background distributions (gray) are derived by permuting the order of stages when computing the pairwise correlation between tRNA genes. P-values (P, χ2-test) are reported in top right of each panel.


