
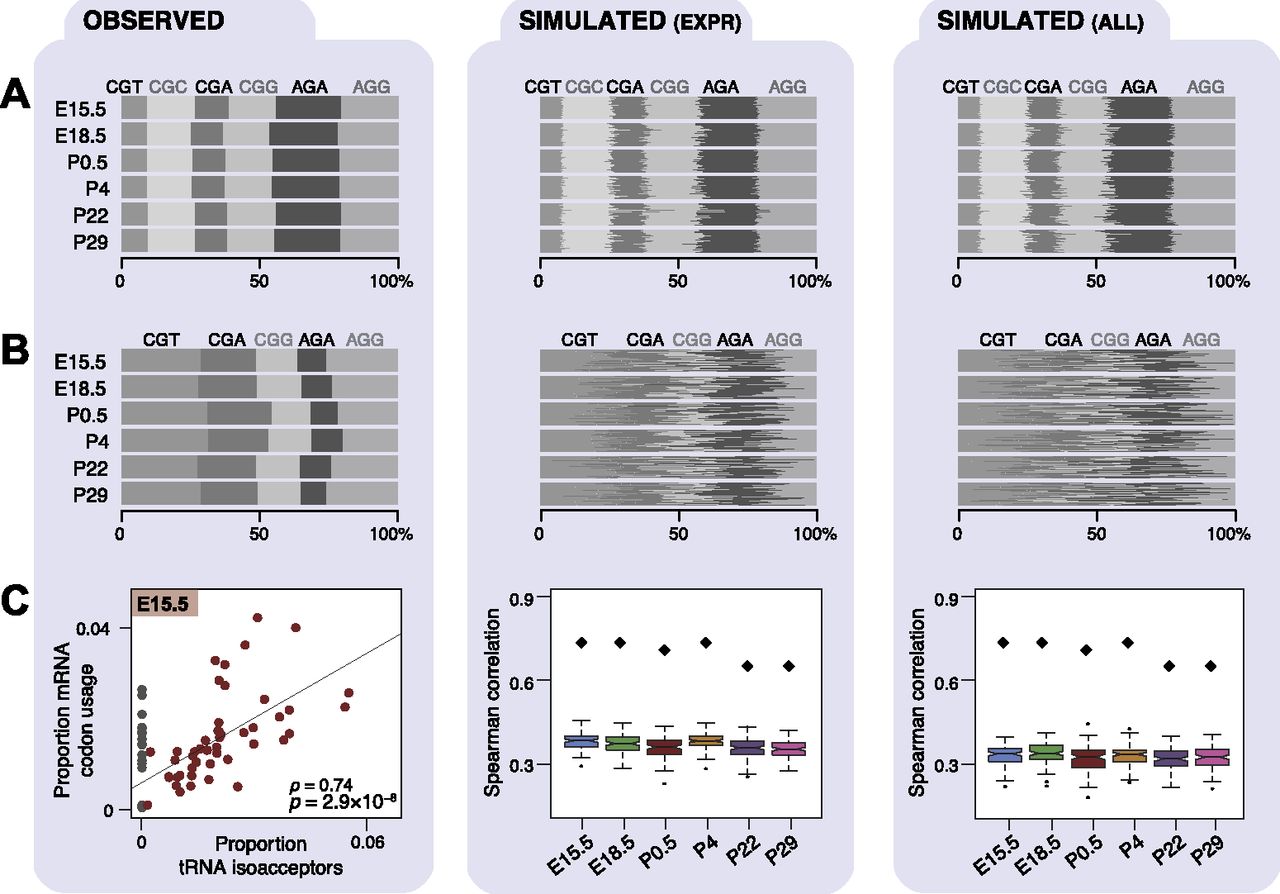
Codon and anticodon usage in transcriptomes across mouse development. Each panel (A–C) consists of three columns: experimentally observed data (left), simulated patterns of transcription randomized among either the expressed genes (middle), or all genomically encoded genes (right). Transcriptomes of each developmental stage were simulated 100 times (Methods). Proportional frequencies weighted by transcript expression are shown for arginine triplet codons as a bar plot (A), where gray shading is by triplet codon. Proportional frequencies weighted by Pol III binding are shown for arginine isoacceptors as a bar plot (B). (C) Plots show Spearman’s rank correlation coefficients (ρ) and P-values (P) of Pol III binding to tRNA isoacceptors (x-axis) and transcriptomic codon frequencies weighted by expression obtained from mRNA-seq data in E15.5 liver (experimentally observed data) and all six developmental stages (simulated data). Anticodon isoacceptors that are not encoded in the mouse genome (gray dots in C) were excluded from calculating the correlation coefficients. Observed correlations across all stages are indicated by black diamonds in plot C, middle and left panels.


