
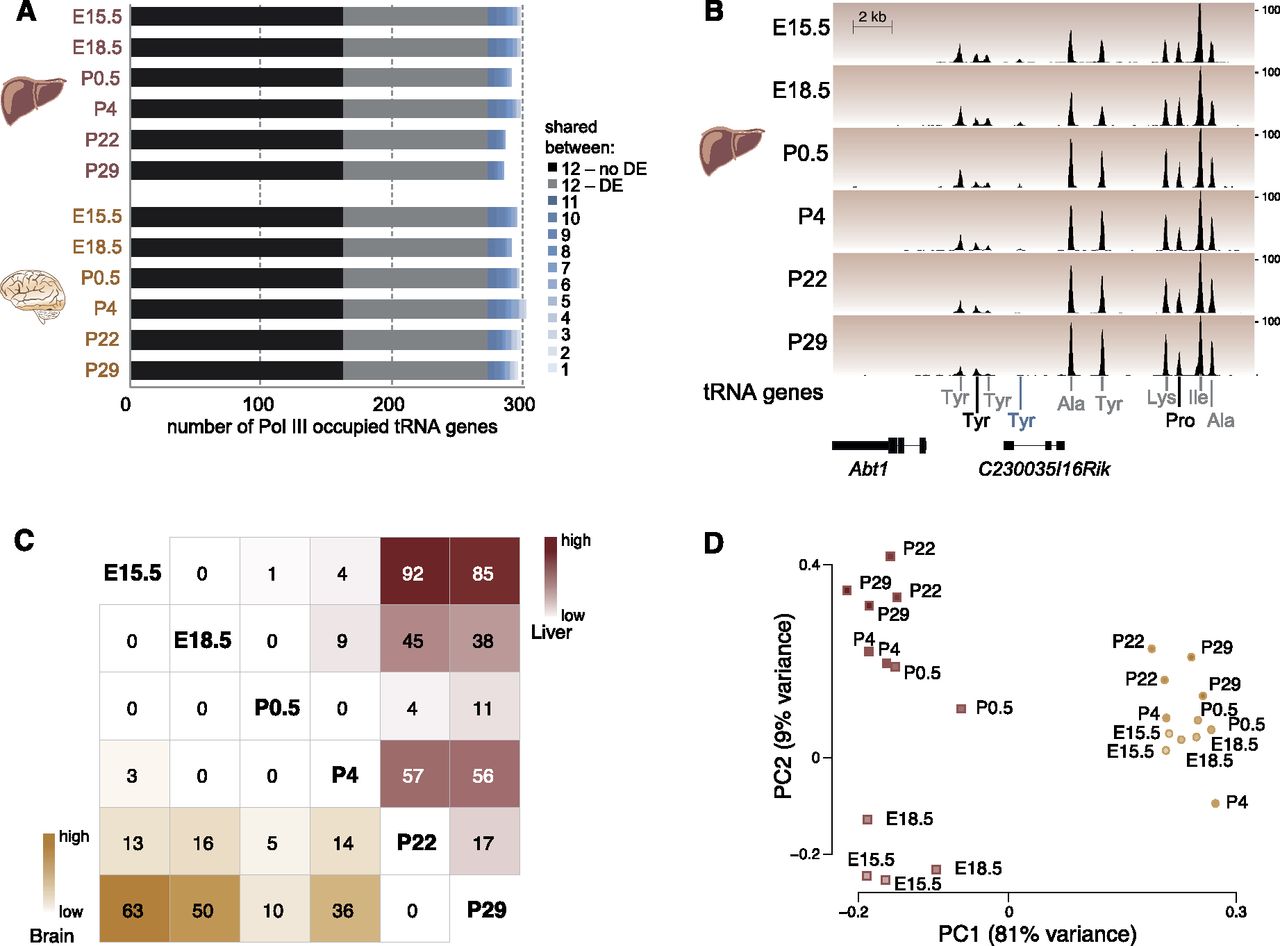
tRNA genes are differentially expressed during mouse development. (A) Stacked bar graph representing total number of expressed tRNA genes in developing mouse liver and brain tissue. Black (no differential expression) and gray (differential expression) represent number of tRNA genes expressed in all stages and tissues. In blue are tRNA genes that are shared between one and 11 stages. (B) Pol III binding to tRNA genes for the same genomic region during mouse liver development. Different colors of tRNA gene identifiers correspond to those used in A. The y-axis of each track specifies normalized read density. Scale bar shows length of genomic regions in kilobases (kb). (C) The intersection of the row/column for each developmental stage combination shows the number of differentially expressed tRNA genes in liver (top right triangle) and brain (bottom left triangle) (0.1% FDR). (D) Factorial map of the principal component (PC) analysis of tRNA gene expression levels in liver (red) and brain (yellow). The proportion of variance explained by each principal component is indicated in parentheses. Color gradient indicates developmental stage (light: young; dark: old).


