
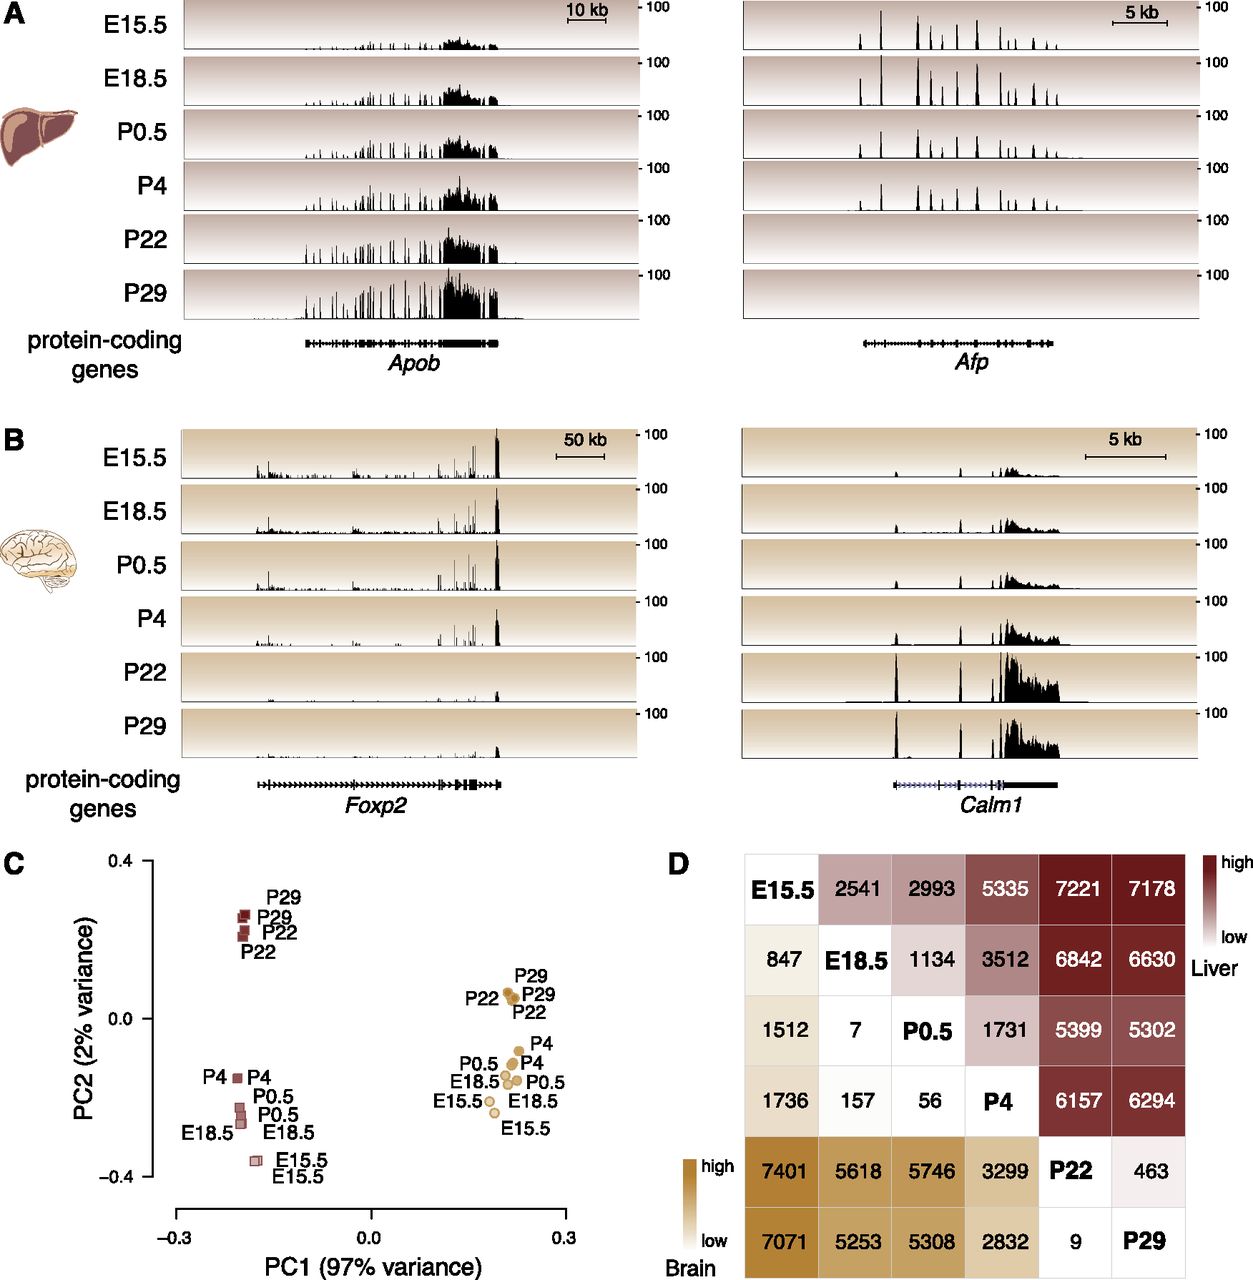
Protein-coding genes are differentially expressed in developing mouse liver and brain. Representative examples of protein-coding gene expression during development are (A) total RNA-seq reads mapping to Apob and Afp genes in liver and (B) Foxp2 and Calm1 genes in brain. The y-axis of each track specifies normalized read density. The scale bar shows length of genomic regions in kilobases (kb). (C) Factorial map of the principal component (PC) analysis of global protein-coding gene expression levels in liver (red) and brain (yellow) tissues. The proportion of variance explained by each principal component is indicated in parentheses. Color gradient indicates developmental stage (light: young; dark: old). (D) The intersection of the row/column for each developmental stage combination shows the number of differentially expressed protein-coding genes between the respective stages in liver (top right triangle) and brain (bottom left triangle) (0.1% FDR).


