
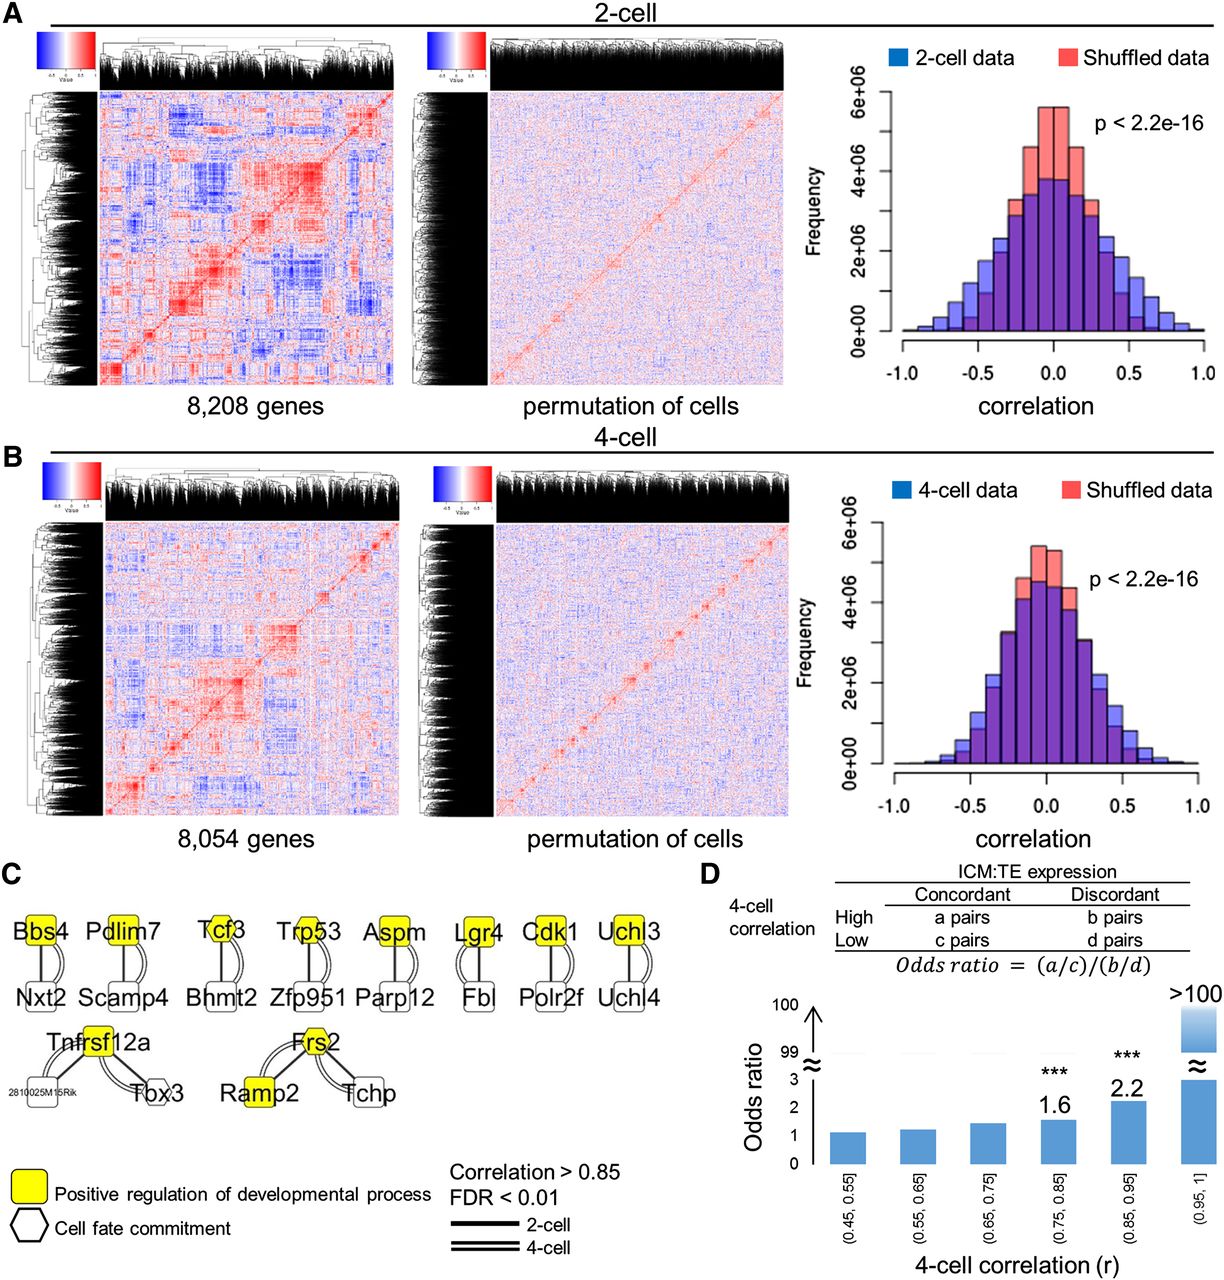
Coexpression networks resulted from inter-blastomere differences. (A,B) Correlation heatmaps of all genes after removing between-embryo variation (left) indicates the existence of coexpression networks (red blocks). The networks disappeared after permuting the cell labels (middle), which essentially produces data from the equivalence hypothesis. There were considerably more correlated and anticorrelated gene pairs in the real data than in the permuted data (right). (C) A subset of gene pairs with strong correlations at both 2-cell and 4-cell stages. This subset contained the genes with GO annotations “positive regulation of developmental processes” or “cell fate commitment.” (D) Consistency of gene expression differences at 4-cell and blastocyst stages. Gene pairs are categorized by their correlation (r) at the 4-cell stage (x-axis). A large r suggests that a gene pair shares this same direction of inter-blastomere differences. Odds ratio (OR) was used to represent the chances of these gene pairs exhibiting the same direction of expression differences between ICM and TE. OR had a monotone increase with respect to 4-cell r. (***) P-value < 10−3. (0.45, 0.55] is equivalent to 0.45 < r ≤ 0.55.


