
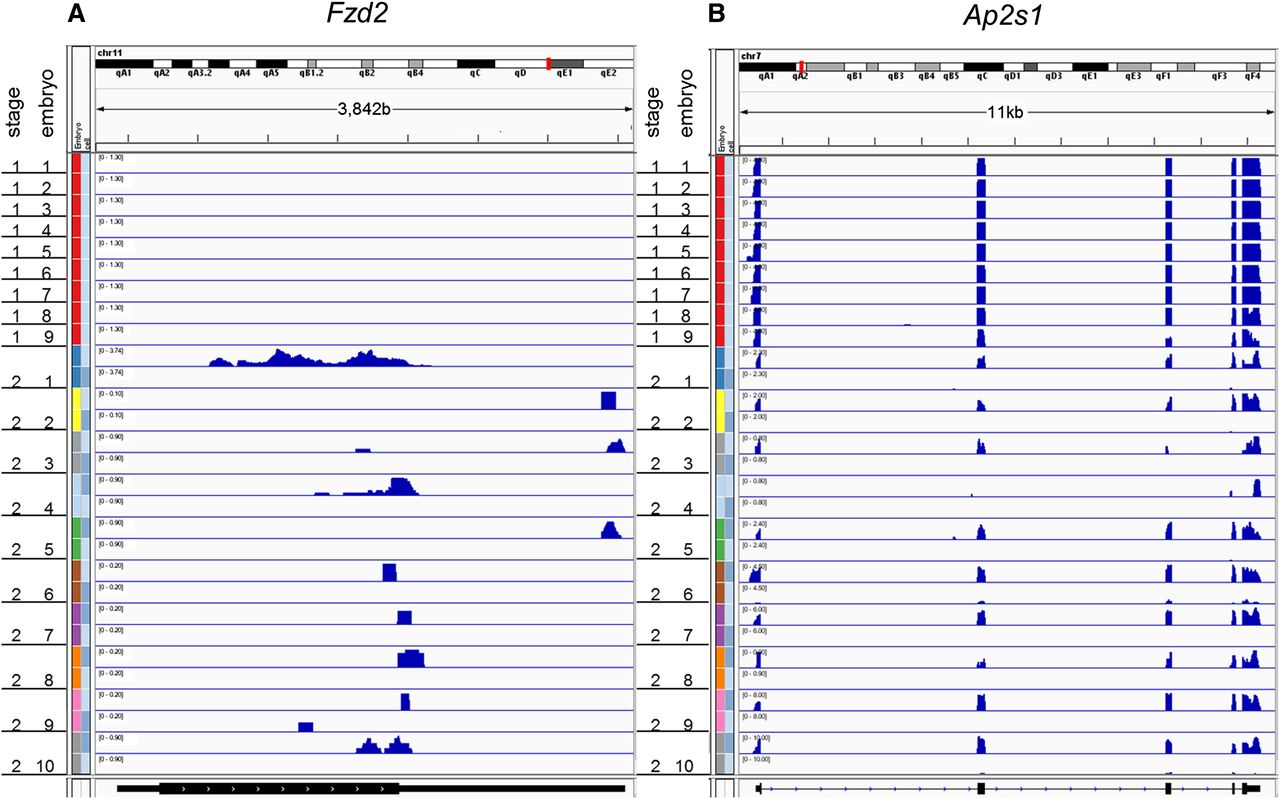
Figure 5.
Coverage plots of single-cell RNA-seq reads. Each row represents a cell. The gene models are at the bottom of the plots. (A) Fzd2, a candidate bimodality gene due to EGA. (B) Ap2s1, a candidate bimodality gene due to blastomere-specific RNA depletion.


