
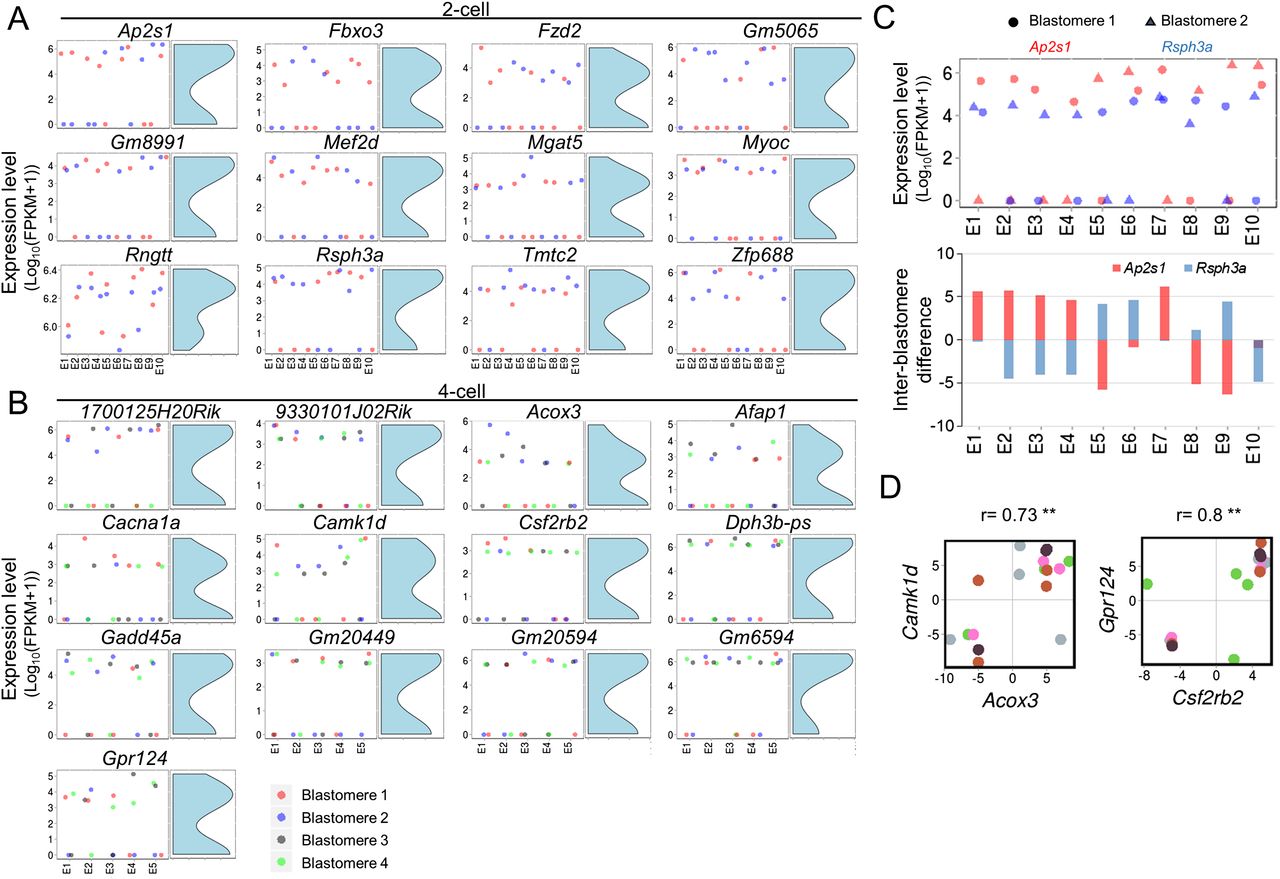
Figure 3.
Bimodality of gene expression in sister blastomeres. (A,B) Expression levels and their histograms. (E1–E10) Embryos 1 to 10. The two (four) blastomeres of each embryo are randomly assigned to two (four) colors. (FPKM) Upper quartile normalized FPKM. (C) Anticorrelation of 2-cell bimodality genes Ap2s1 and Rsph3a. Juxtaposition (upper) and inter-blastomere difference (lower) of expression levels in the same embryos. (D) Correlated genes at the 4-cell stage. Cells from the same embryo have the same color. (r) Pearson correlation. (**) FDR < 0.01.


