
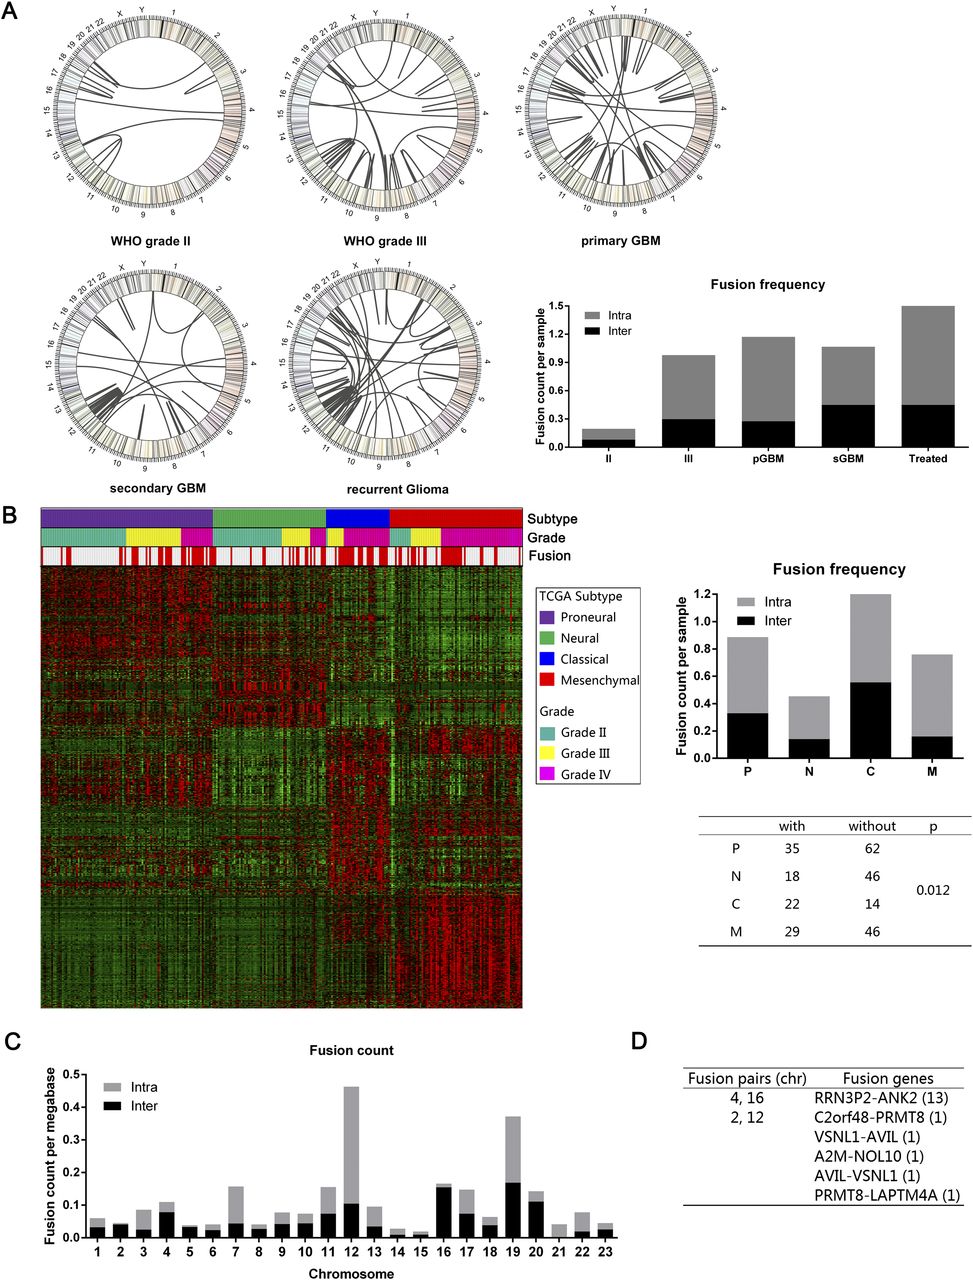
Fusion distribution depending on WHO classification, Cancer Genome Atlas subtypes, or chromosomes. (A) Circos plot of genomic distribution of fusion genes in grade II, grade III, primary GBM, secondary GBM, and recurrent gliomas. (B) Fusion distribution in the four Cancer Genome Atlas subtypes. There was a distinct higher proportion of patients with fusion in a classical subtype (P = 0.012). (C) Genomic distribution of fusion genes, indicating that chromosome 12 was a hot spot for intrachromosome fusion. (D) For the interchromosome fusion detection, chromosomes 4 and 6 and chromosomes 2 and 12 were the fusion pairs with the most interchromosome fusion frequency.


