
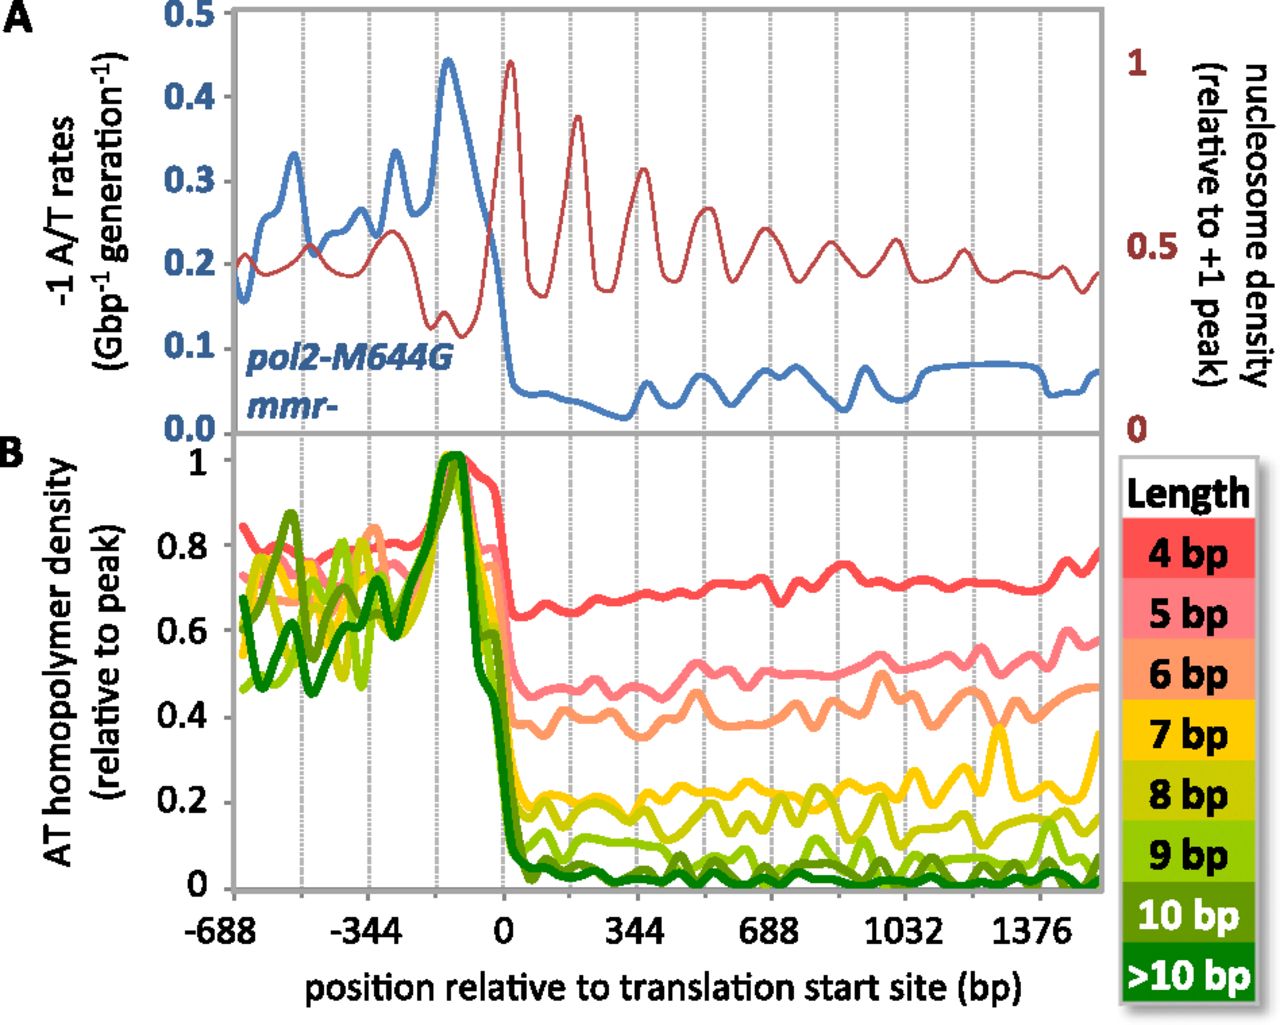
Figure 5.
Indel rates in homopolymers in the absence of MMR. (A) A comparison of nucleosome density (red; relative to the +1 peak) and pol2-M644G mmr- AT deletion rates (blue) as a function of distance from translation start sites. (B) Homopolymer densities (relative to maximum density) for various homopolymer lengths as a function of distance from translation start sites.


