
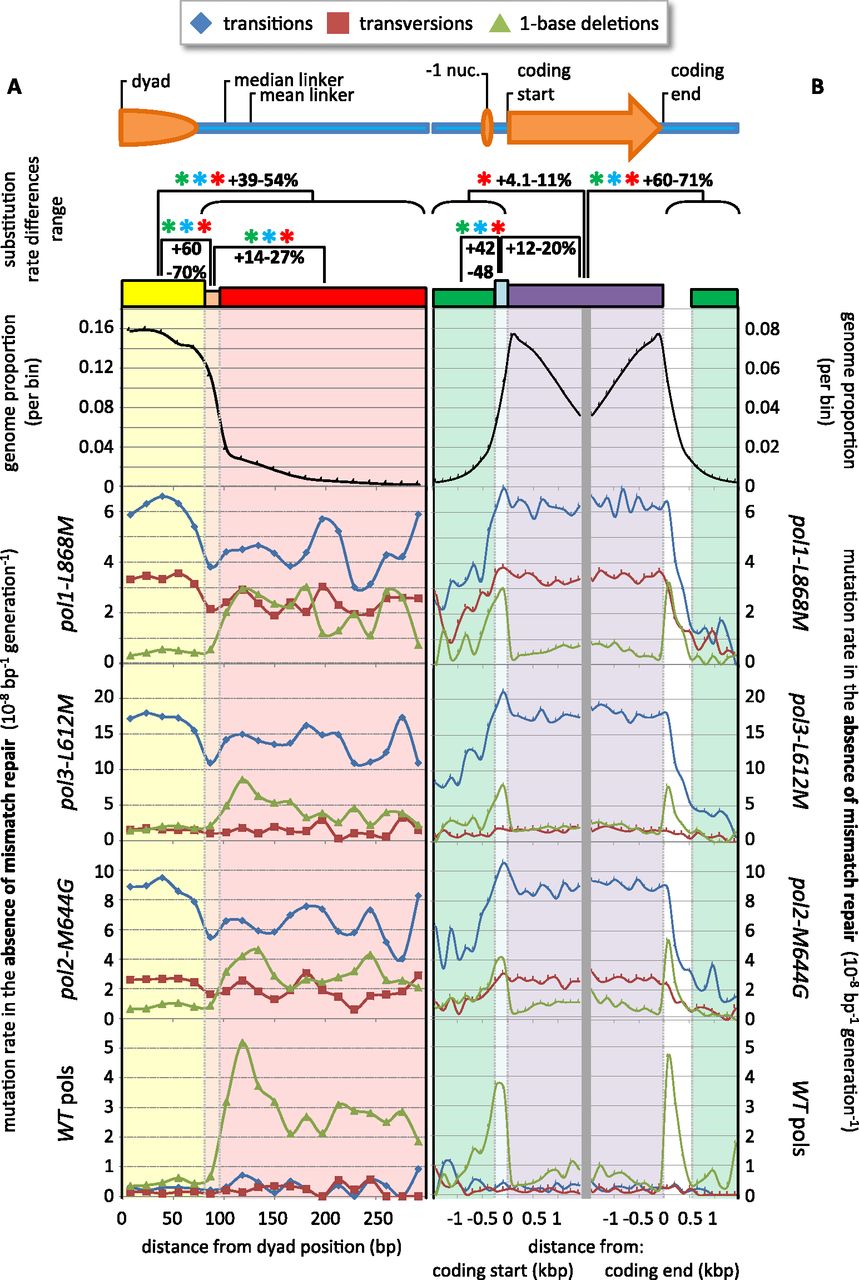
Variation in mutation rates near nucleosome positions and genes. Mutation rates (blue indicates transitions; red, transversions; green, one-base deletions) plotted versus either (A) the distance from either the nearest nucleosome dyad (in base pairs) or (B) from the nearest coding start (left) or end site (right; in kilobase pairs). Asterisks denote significantly different substitution rates between indicated regions (Pol alpha, red; Pol delta, green; Pol epsilon, blue). Percentages denote the magnitude of substitution excesses. Shaded areas are DNA regions: nucleosome-bound (yellow), shorter and longer than average linkers (orange and red, respectively), intergenic (green), 5′ nucleosome-free (blue), and coding (purple).


