
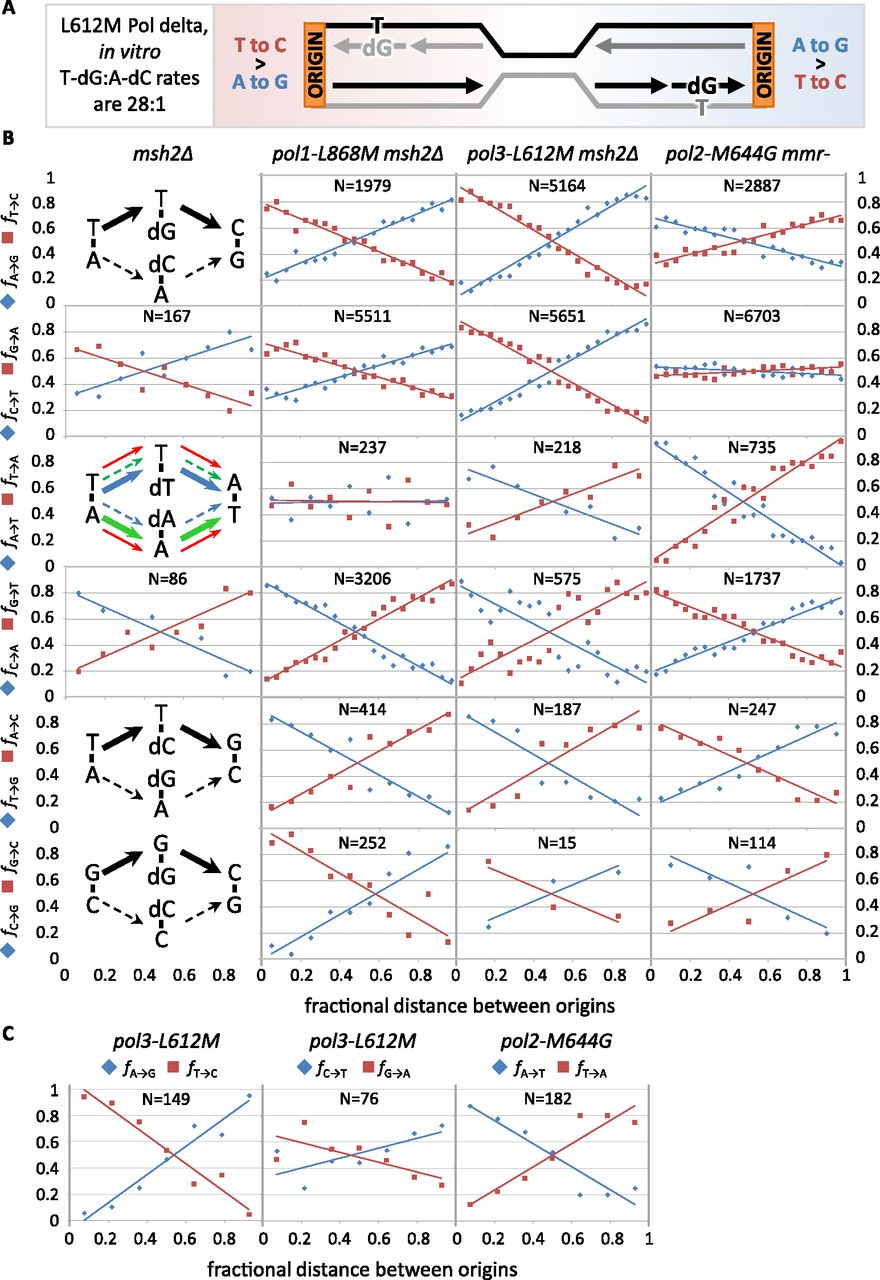
Polymerase and strand specificity of replication errors. Select polymerase-biased complementary mismatch pairs and mismatch motifs. (A) Schematic example of adjacent replication origins and their effects on lagging-strand–biased mutagenesis. The T-dG:A-dC ratio in vitro is from Nick McElhinny et al. (2008). (B) Diagrams are example preferences for complementary mutation pathways. In most cases, the three variant polymerases have the same preference (black arrows). Disagreements are color-coded by polymerase variant: Pol alpha (pol1-L868M), red; Pol delta (pol3-L612M), green; and Pol epsilon (pol2-M644G), blue. Plots are the fraction of each substitution mutation (fi) paired with its complement as a function of relative distance between adjacent replication origins. ([N] Mutation count pooled by strain, excluding mutations in origins.) (C) As for B, but for those mutation types observed >50 times in individual MMR-proficient strains. See also Supplemental Figures S3 and S4.


