
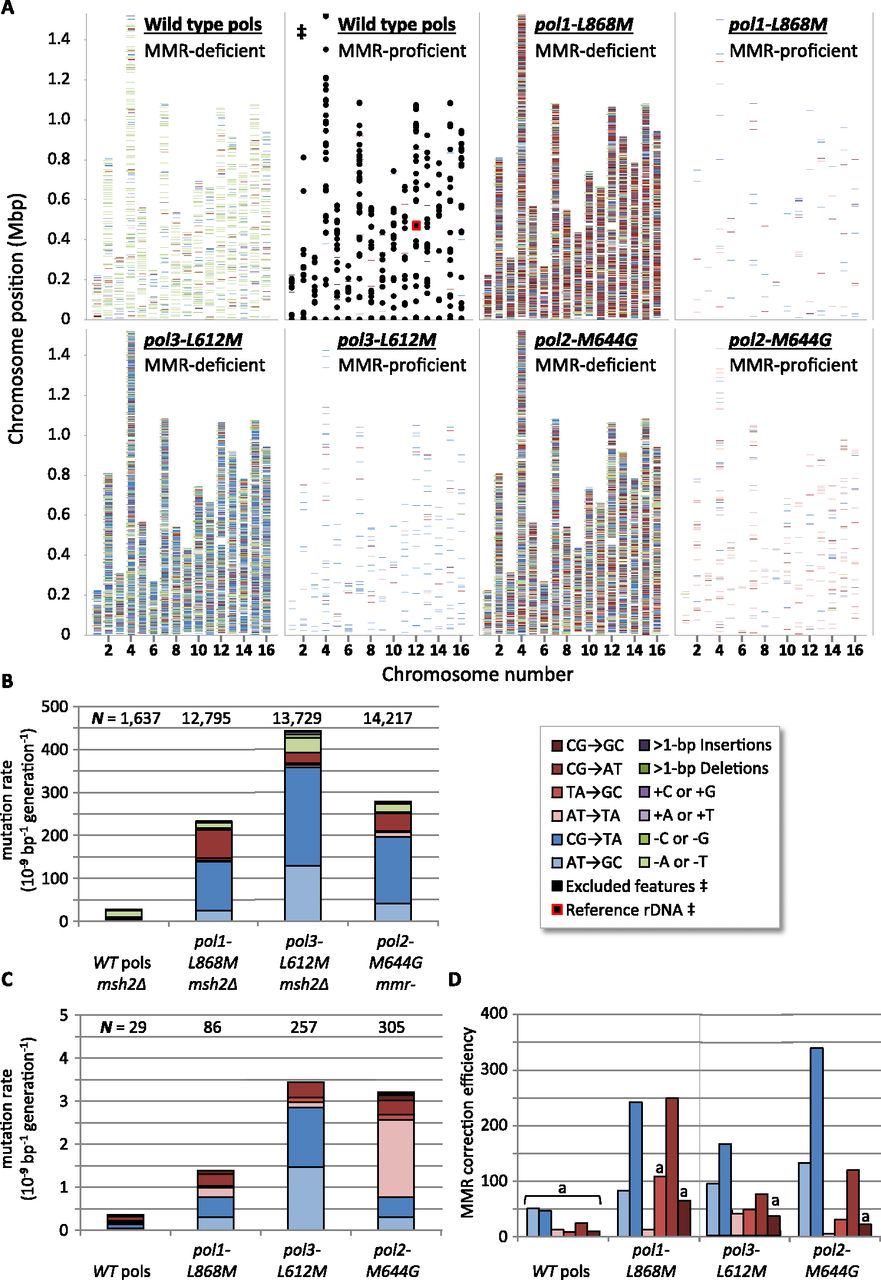
Genome-wide replication error positions, rates, and MMR efficiencies. Transitions are indicated by blue shades (light to dark: AT→GC, CG→TA), transversions by reds (light to dark: AT→TA, TA→GC, CG→AT, CG→GC), deletions by greens (light to dark: −A/T, −G/C, multibase), and insertions by purples (light to dark: +A/T, +G/C, multibase). (A) Positions of more than 43,000 mutations, from all eight strains used in this study, plotted along the 16 S. cerevisiae chromosomes. ([‡] Overlaid black boxes are regions excluded from mutation calling; see Supplemental Methods.) (B) Mutation rates, corrected for genomic GC content from MMR-deficient strains. ([N] Mutation count pooled by strain.) (C) As per B, but for MMR-proficient strains. (D) MMR correction efficiencies for substitution errors in four polymerase allelic backgrounds are ratios of MMR-deficient rates to MMR-proficient rates. ([a] Calculated from <10 observed mutations in MMR-proficient strains; see also Supplemental Fig. S2.)


