
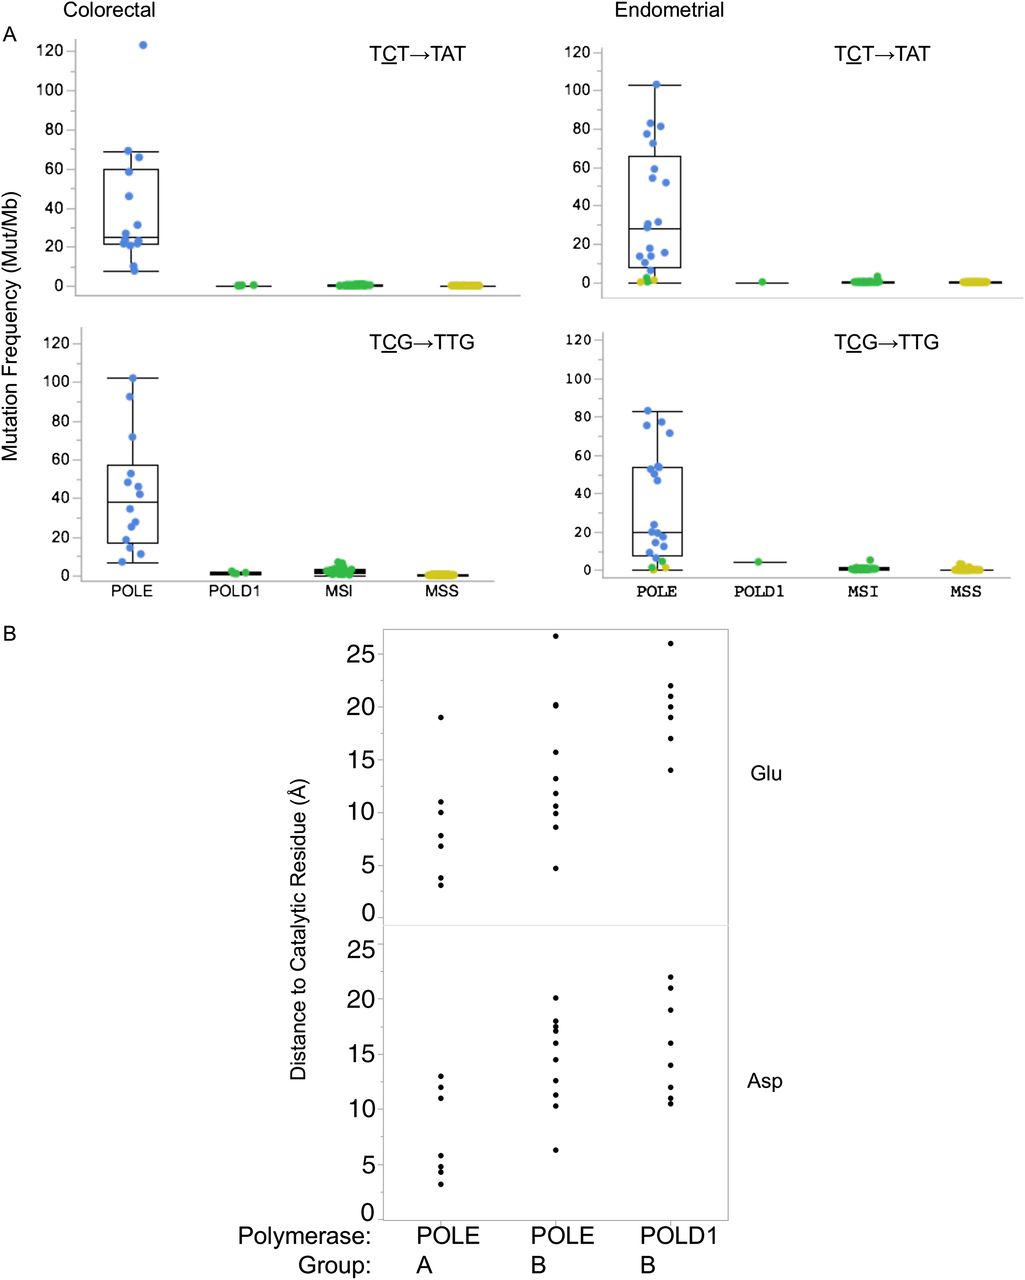
Mutation propensities and structural relationships in POLE- and POLD1-exo* mutants. (A) Frequency of base substitutions with 5′ and 3′ contexts in colorectal (CRC) and endometrial (EEC) cancers in the most common mutation classes. (Upper) TCT→TAT; (lower) TCG→TTG; (left) CRC; (right) EEC. Individual dots represent mutation frequency in individual tumors. Group assignments are represented by colors. (Blue) POLE-exo* Group A; (green) MSI; (yellow) MSS (see also Supplemental Table S1A,B; Supplemental Figs. S1, S2). (B) Distance in angstroms of POLE-exo* mutations to the exonuclease catalytic residues. POLE-exo* Group A, POLE-exo* Group B, and POLD1-exo* Group B mutant residues were mapped to the yeast 3D structure, POLE PDB accession 4M8O (Hogg et al. 2014), and to POLD1-exo DNA PDB accession 3IAY (Swan et al. 2009) by homology using PyMOL (http://www.pymol.org). PyMol was used to estimate the distance from the mutated residue to either catalytic site residue. Top panels are the distances to the catalytic glutamate (Glu) residue of either polymerase; bottom panels are the distances to the catalytic aspartate (Asp) residue of either polymerase. The Group A or B category is defined in Tables 1, 2 (see also Supplemental Table S5). The polymerase group is indicated on the x-axis and the distance to either catalytic residue on the y-axis. (Asp) Exonuclease active site residues D275 (POLE) or D316 (POLD1); (exo) exonuclease catalytic residues E277 (POLE) and E318 (POLD1). Note that no Group A or B mutations have yet been found with 11 Å of the exonuclease catalytic site of POLD1. (See also Supplemental Fig. S1A,B.)


