
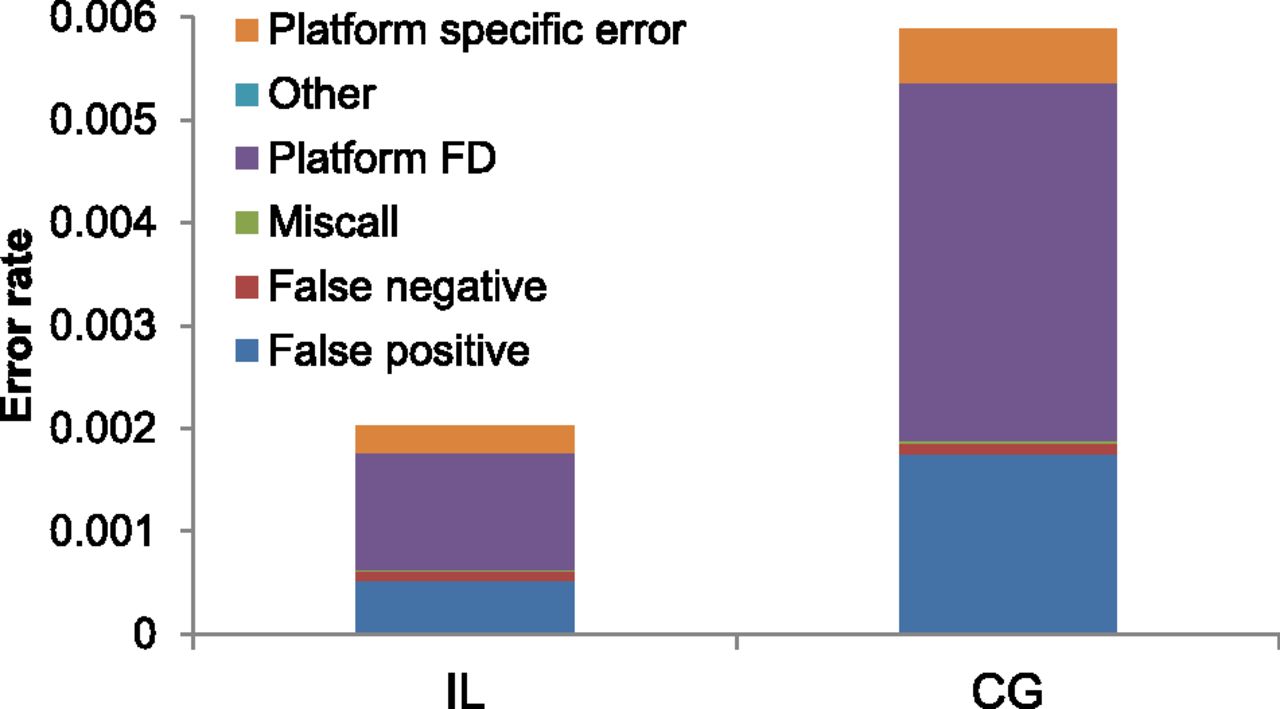
Figure 5.
Total error rate for sites with GQ ≥ 40, partitioned across categories, for different WGS data sets. The six different colors represent the six different error types described in the text.
(Downloading may take up to 30 seconds. If the slide opens in your browser, select File -> Save As to save it.)
Click on image to view larger version.
Total error rate for sites with GQ ≥ 40, partitioned across categories, for different WGS data sets. The six different colors represent the six different error types described in the text.
 CiteULike
 Delicious
 Digg
Digg Facebook
 Google+
 Reddit
 Twitter
