
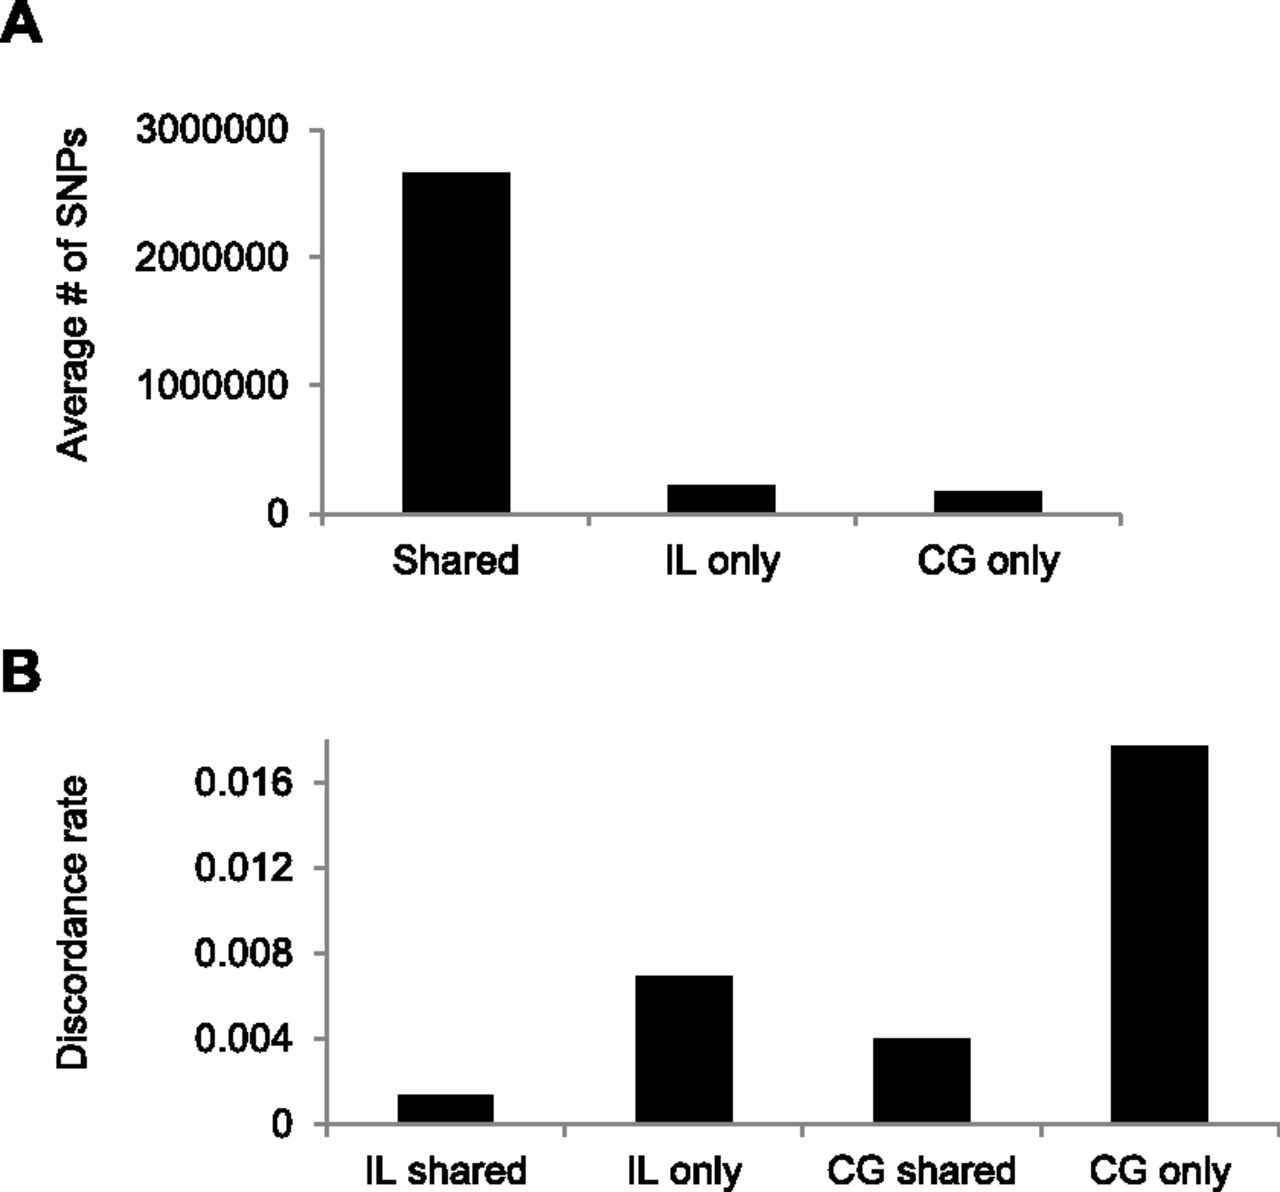
Figure 4.
Average number of called SNVs shared between platforms or unique to one platform (A), and the genotype discordance rate (between blood and saliva samples) for shared and platform-specific SNVs (B).
(Downloading may take up to 30 seconds. If the slide opens in your browser, select File -> Save As to save it.)
Click on image to view larger version.
Average number of called SNVs shared between platforms or unique to one platform (A), and the genotype discordance rate (between blood and saliva samples) for shared and platform-specific SNVs (B).
 CiteULike
 Delicious
 Digg
Digg Facebook
 Google+
 Reddit
 Twitter
