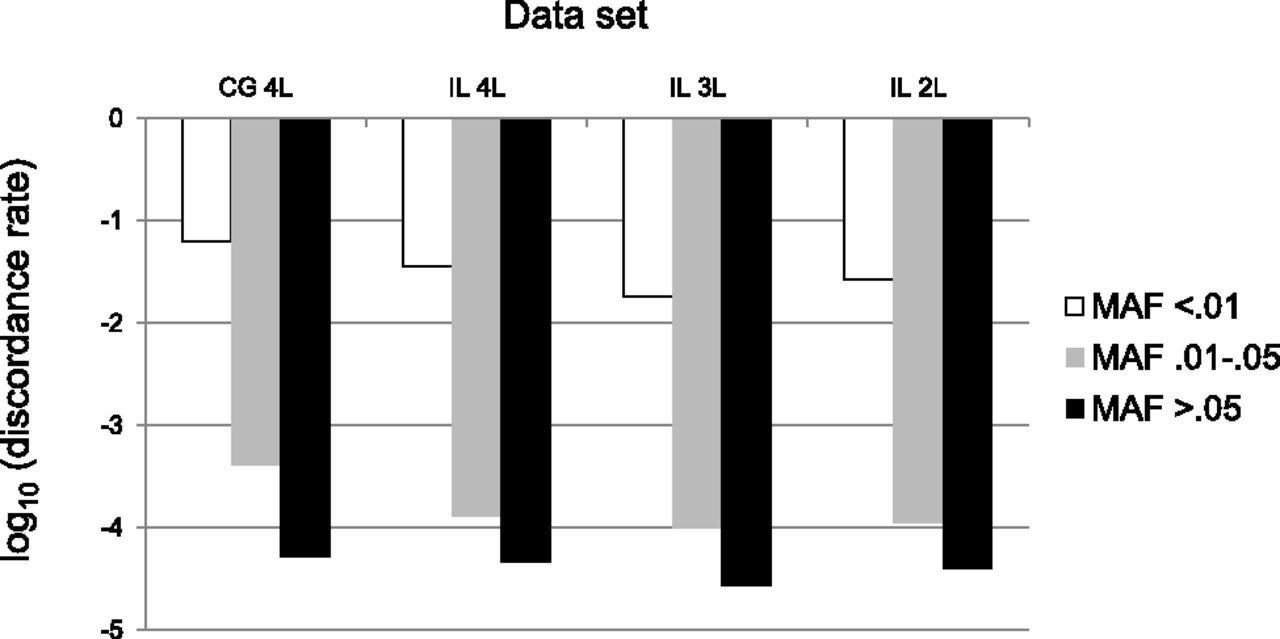
Estimating genotype error rates from high-coverage next-generation sequence data

(Downloading may take up to 30 seconds. If the slide opens in your browser, select File -> Save As to save it.)

Click on image to view larger version.

Figure 3.
Figure 3.

Genotype discordance rate for whole-genome data stratified by minor allele frequency (MAF) for different sequencing platforms (IL, Illumina; CG, Complete Genomics) and levels of coverage (4L, four lanes; 3L, three lanes; 2L, 2 lanes).

This Article

  1. Genome Res. 24: 1734-1739

Preprint Server