
Figure 2.
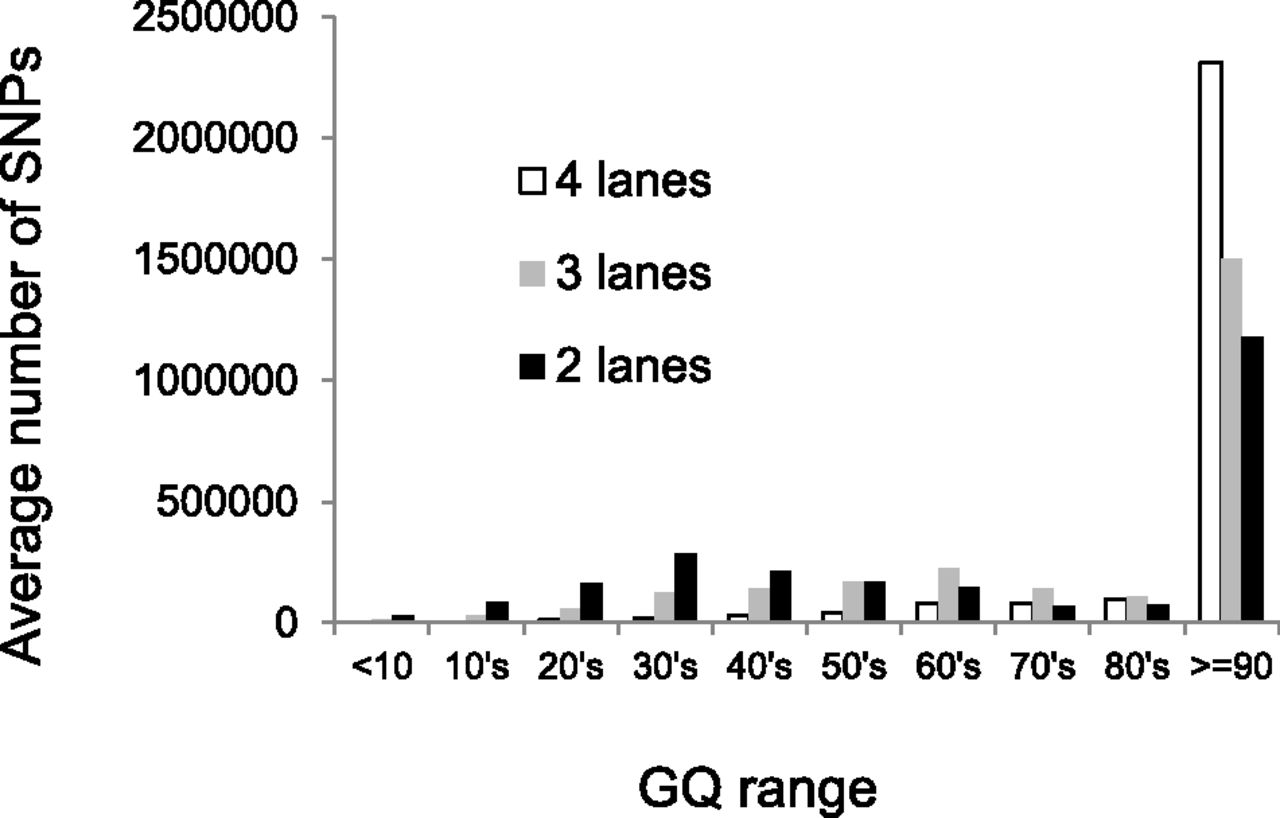
Average number of SNVs called per sample, stratified by GQ score (x-axis) and average level of coverage. Each “lane” corresponds to 32 GB of total sequence.
(Downloading may take up to 30 seconds. If the slide opens in your browser, select File -> Save As to save it.)
Click on image to view larger version.
Average number of SNVs called per sample, stratified by GQ score (x-axis) and average level of coverage. Each “lane” corresponds to 32 GB of total sequence.
 CiteULike
 Delicious
 Digg
Digg Facebook
 Google+
 Reddit
 Twitter
