
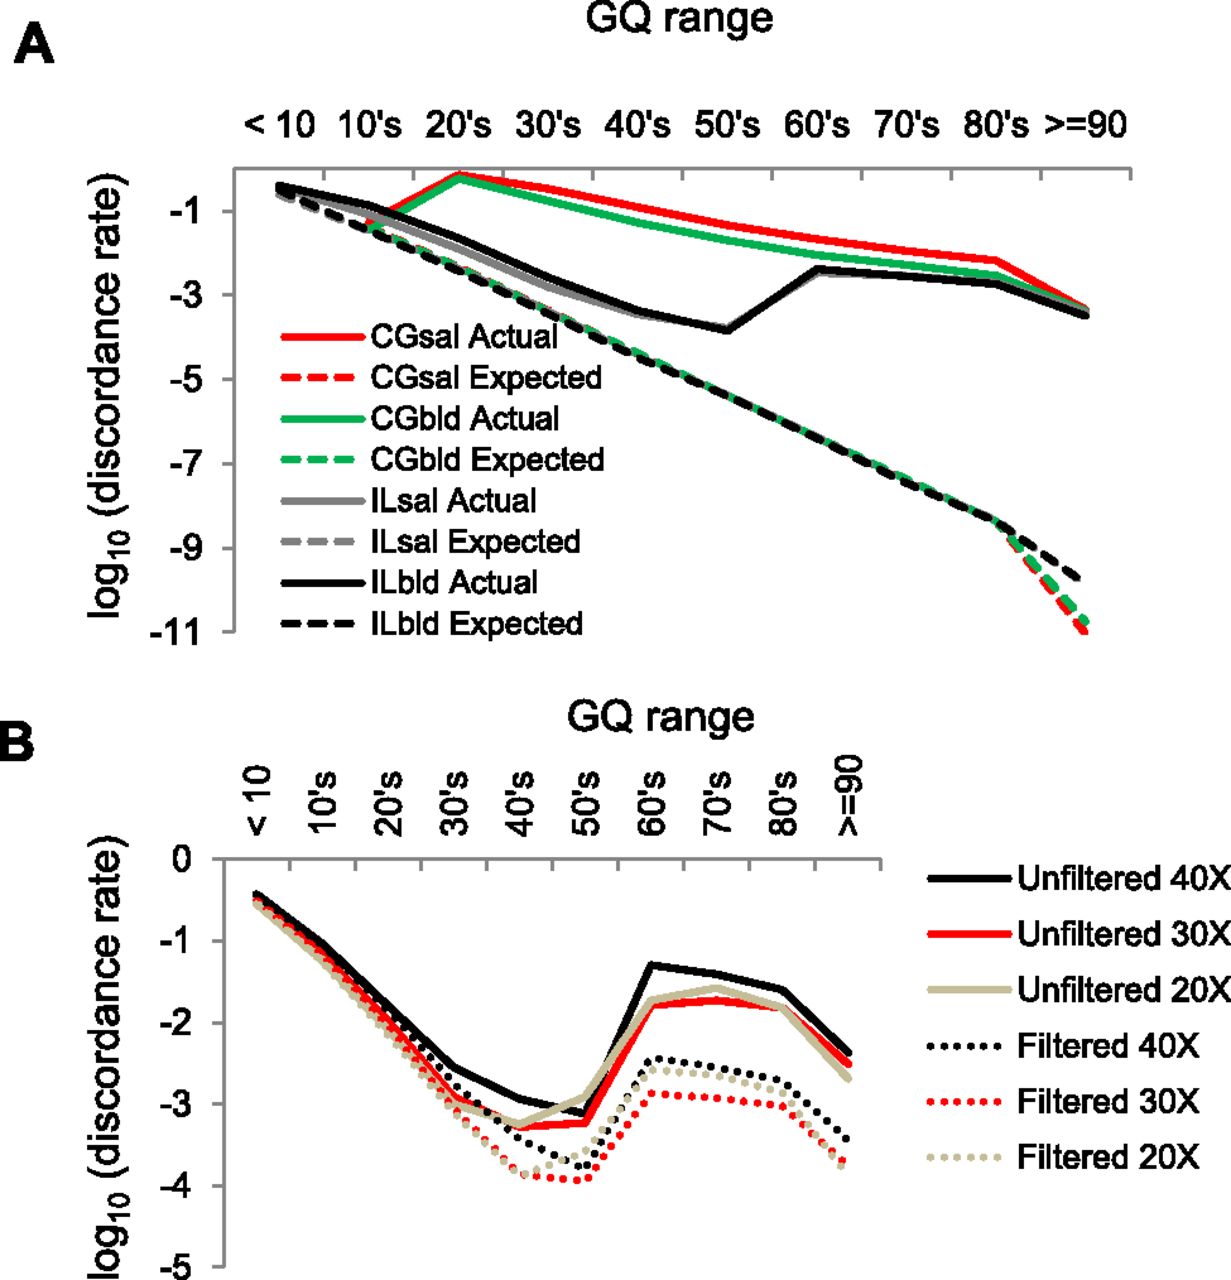
Figure 1.
Expected and actual genotype discordance rates as a function of GQ (genotype quality) score. (A) Illumina (IL) and Complete Genomics (CG) sequences from saliva (sal) and blood (bld) samples. (B) IL discordance, with or without SNP filters, and for different depths of coverage.


