
Figure 2.
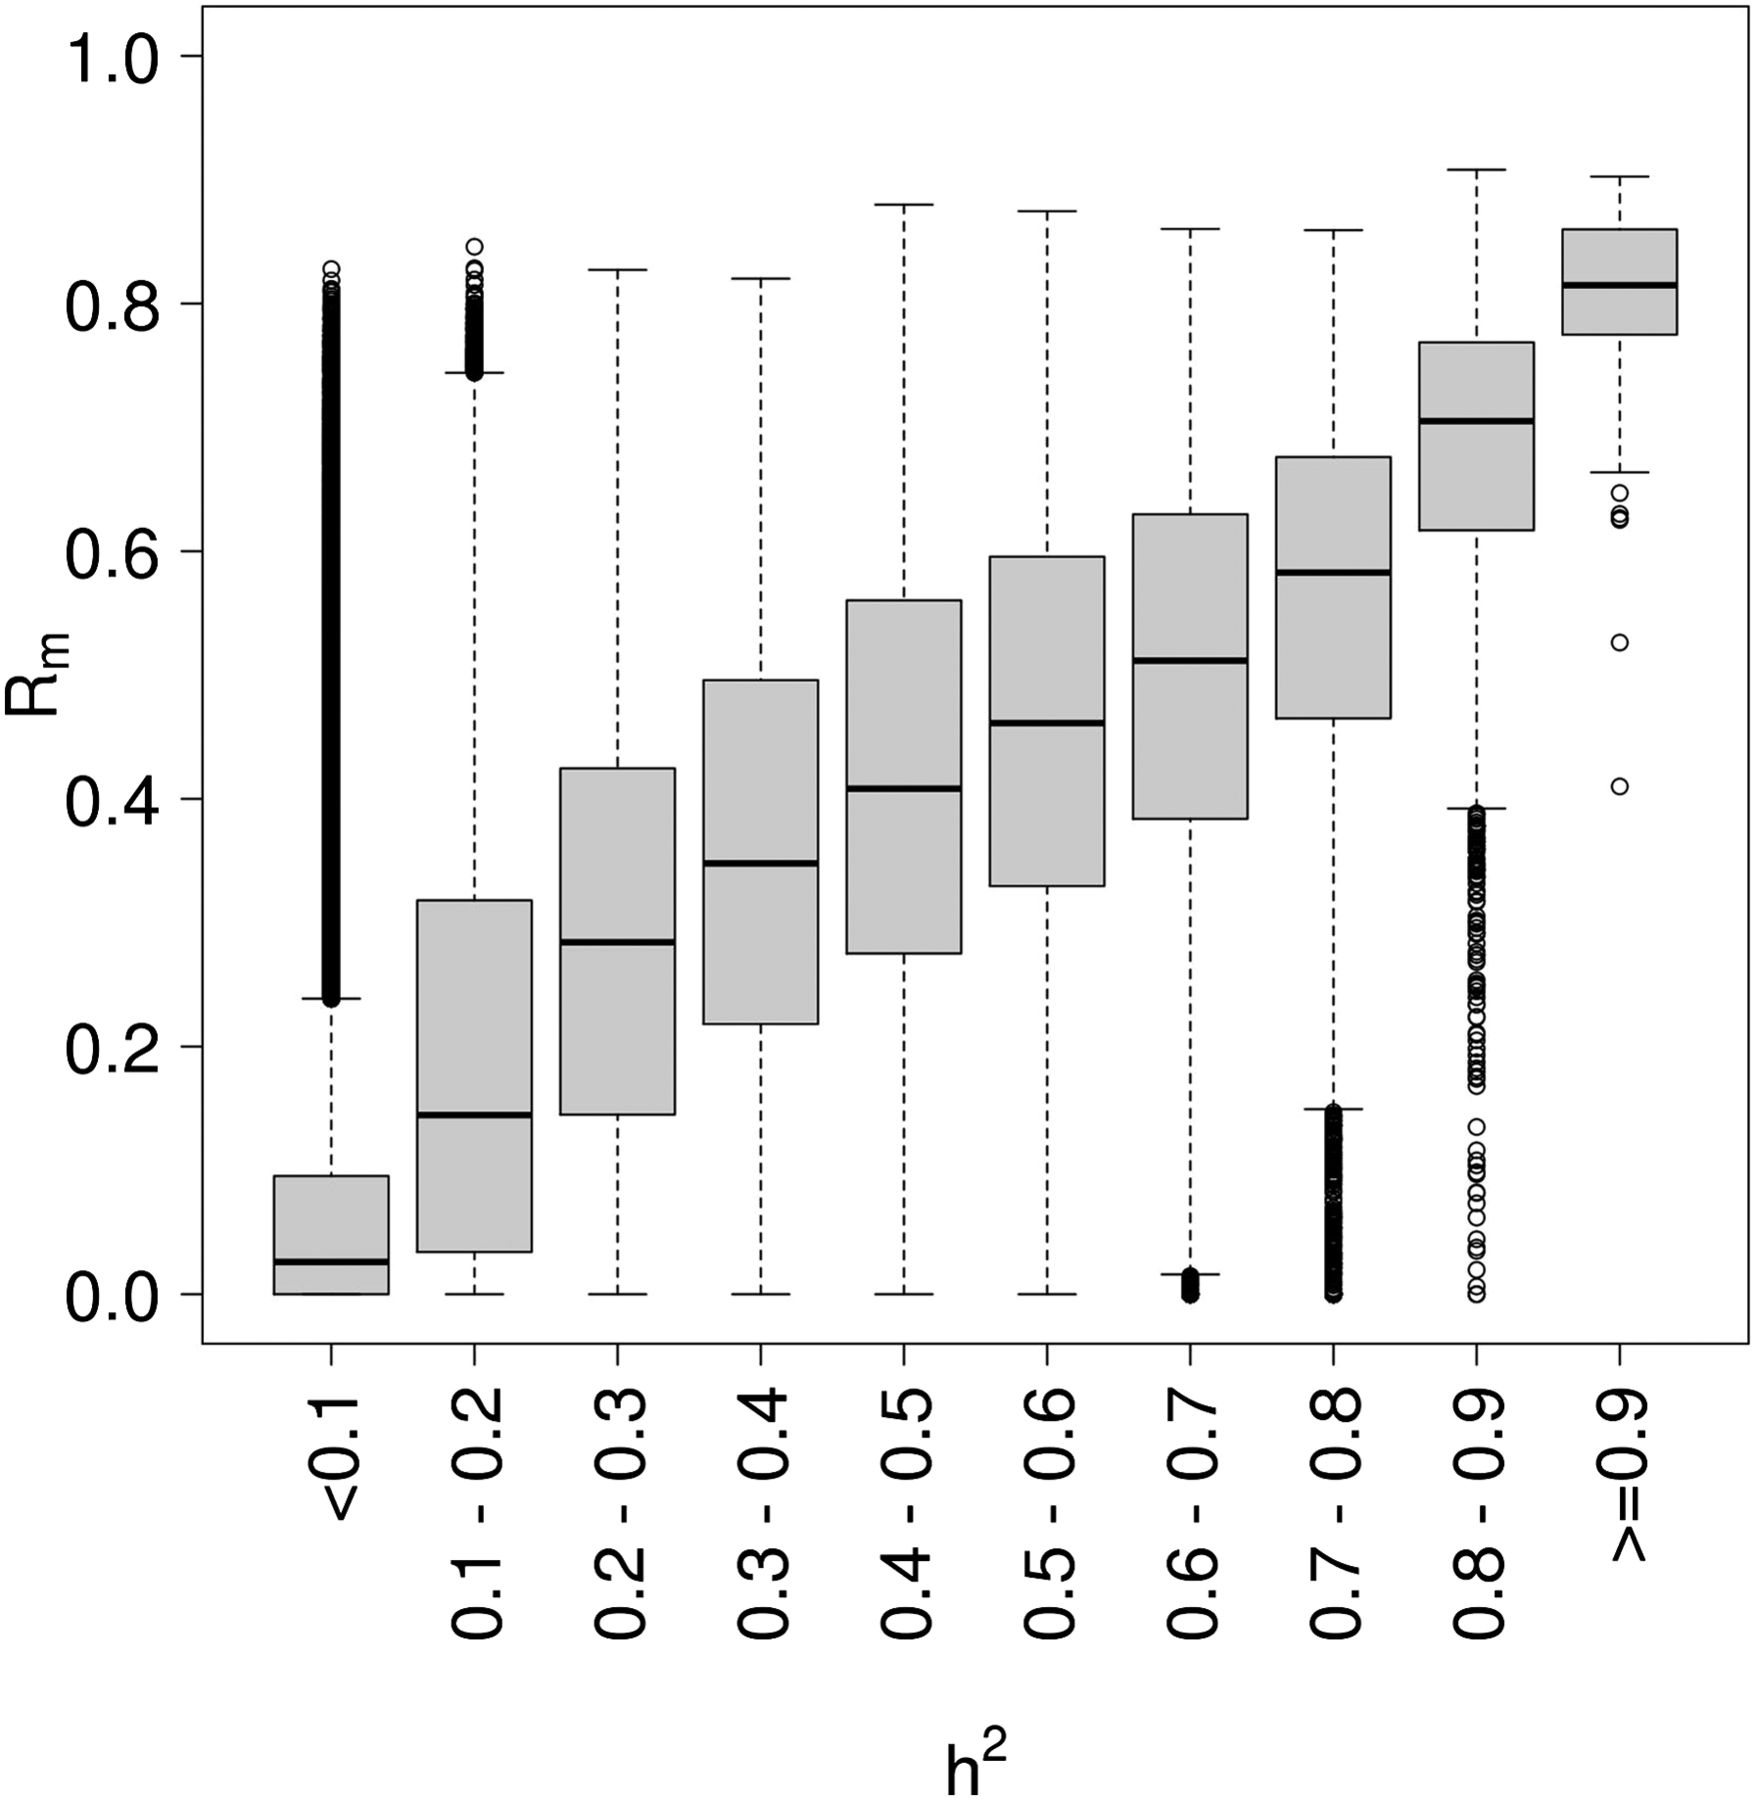
Correlation between Rm and h2. The distribution of Rm estimated in the LBC cohorts by bins of h2 estimated in the BSGS cohort. Correlation between the two measures was 0.68.
(Downloading may take up to 30 seconds. If the slide opens in your browser, select File -> Save As to save it.)
Click on image to view larger version.
Correlation between Rm and h2. The distribution of Rm estimated in the LBC cohorts by bins of h2 estimated in the BSGS cohort. Correlation between the two measures was 0.68.
 CiteULike
 Delicious
 Digg
Digg Facebook
 Google+
 Reddit
 Twitter
