
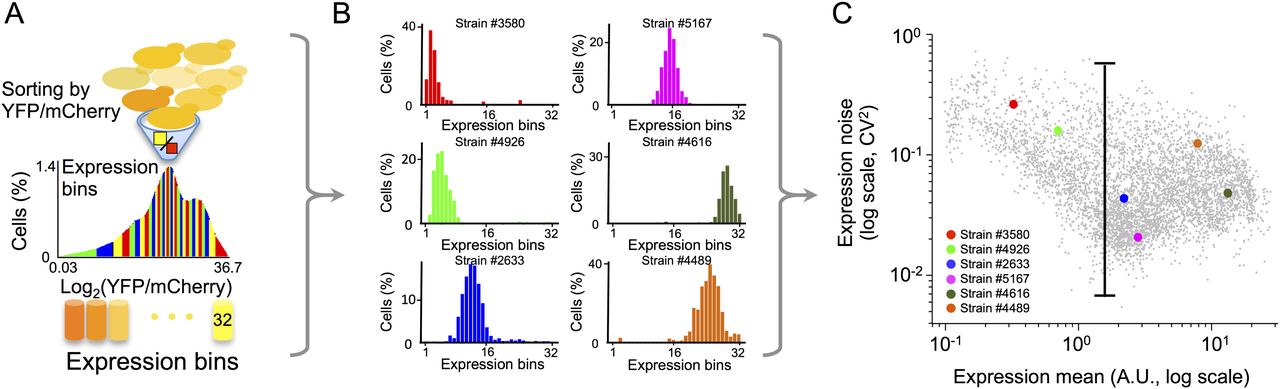
Measuring the single-cell gene expression distribution of thousands of designed promoter sequences within a single experiment. (A) Cells of the pooled library of 6500 strains are sorted into 32 expression bins. (B) The single-cell expression distribution of each strain is reconstructed by determining the fraction of cells that contain each promoter in every expression bin using parallel sequencing of the promoter region. Shown are single-cell expression distributions of six strains from the library. The mean, noise, and noise strength of each strain are then extracted from these distributions (see Methods). (C) Shown is the mean expression (x-axis) and noise (y-axis) of each of the 6500 different library strains. Colored points correspond to the six strains shown in B. Also shown is a vertical line corresponding to a nearly two orders of magnitude range in noise.


