
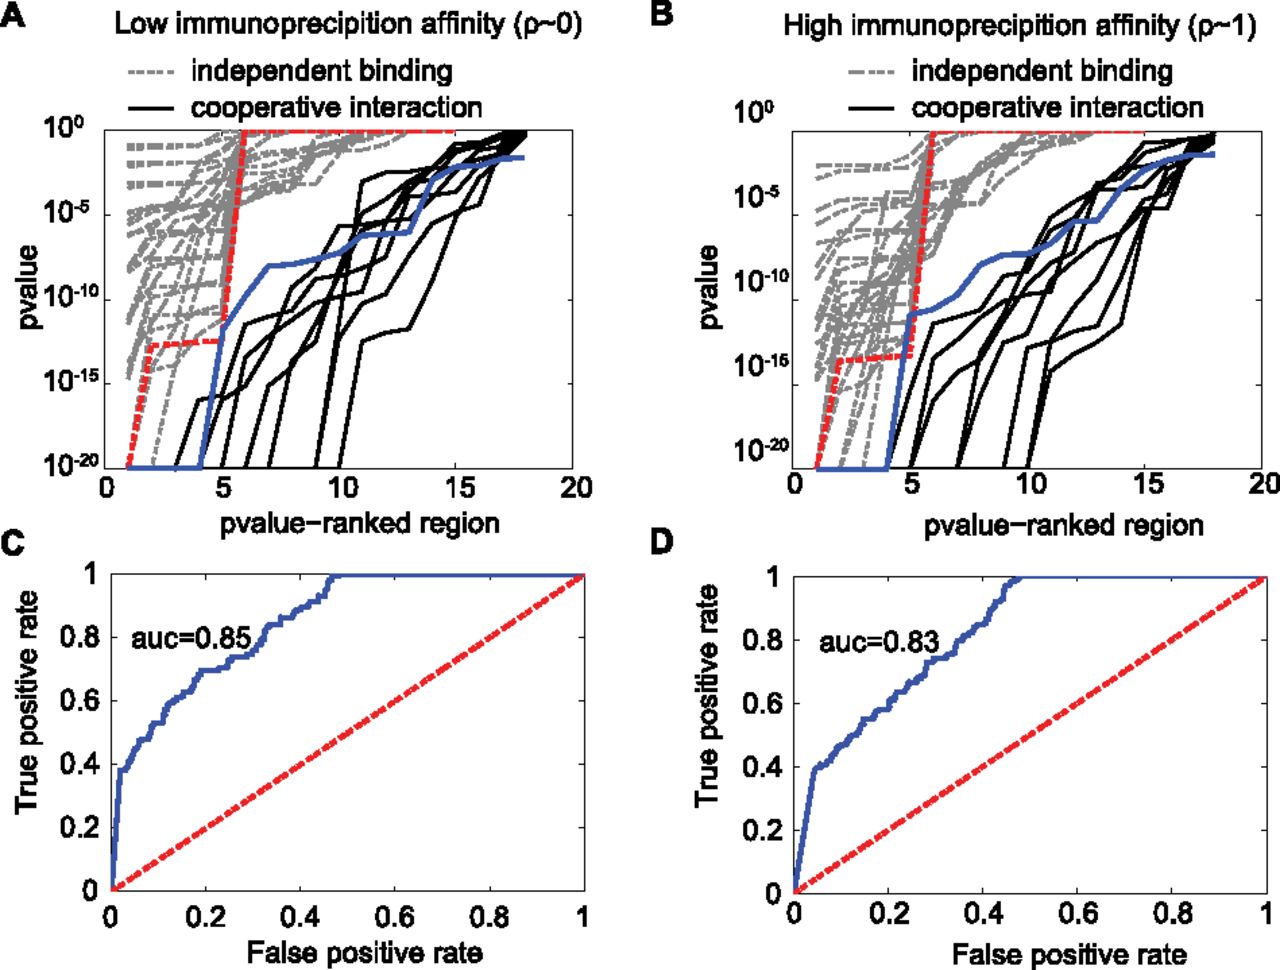
The double-binding signal allows the detection of cooperative interaction from the ChIP-seq data. Our method (Equation 8) is able to distinguish regions containing cooperative interacting sites from regions containing independent binding sites. A set of regions with experimentally validated cooperative interaction is used as a positive control (Chauhan et al. 2011). The negative control is obtained from simulation (Supplemental Figs. S3, S4; Supplemental Table S2; also see Methods). (A,B) The P-value output of our method is able to discriminate regions with cooperative interaction (solid lines) from regions with independent binding (dashed lines). Each dashed line represents a different simulated set. Each solid line assumes a different value for the probability of nonbinding configuration (see Methods). The probability of nonbinding configuration is a necessary input to compute the statistical P-value. Independent of the value for nonbinding configuration, our method discriminates the data well. A good discriminative power occurs even for the most conservative case (highlighted by the dashed red and solid blue lines). (C,D) The overall performance of our method is measured in terms of true versus false positive rate. The solid blue line represents the results from A or B. The dashed red line shows what is expected by chance. The area under the curve (AUC) measures the discriminative power of the method. All results support our method. In addition, the method is robust when performance evaluation is specific to each probability of nonbinding configuration (Supplemental Figs. S5, S6). The results at the left (A,C) and right (B,D) panels are obtained assuming low or high immunoprecipitation rate, respectively.


