
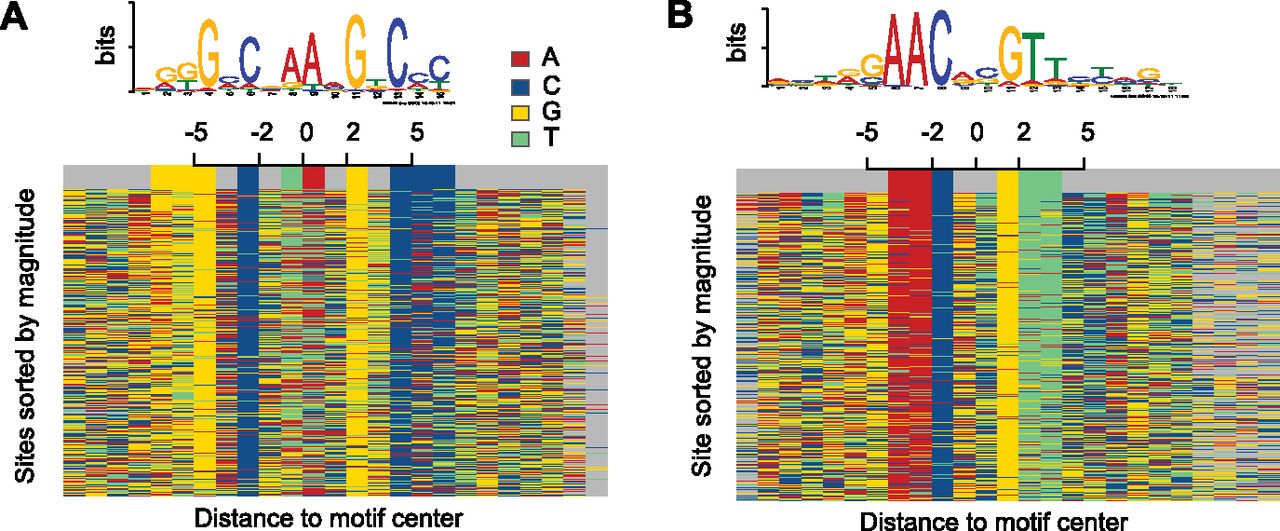
Figure 4.
The binding motif can be observed in the sequence that surrounds the predicted binding site. This figure depicts the high resolution of our method. Each row indicates the sequence surrounding a predicted motif center. Different colors represent a different DNA letter. Results are shown for two distinct ChIP-seq experiments performed for the M. tuberculosis transcription factor DosR (A) and Kstr (B). A small shift at the motif center was allowed to improve visualization. Average shift was < 2 bp and is visualized by gray colors.


