
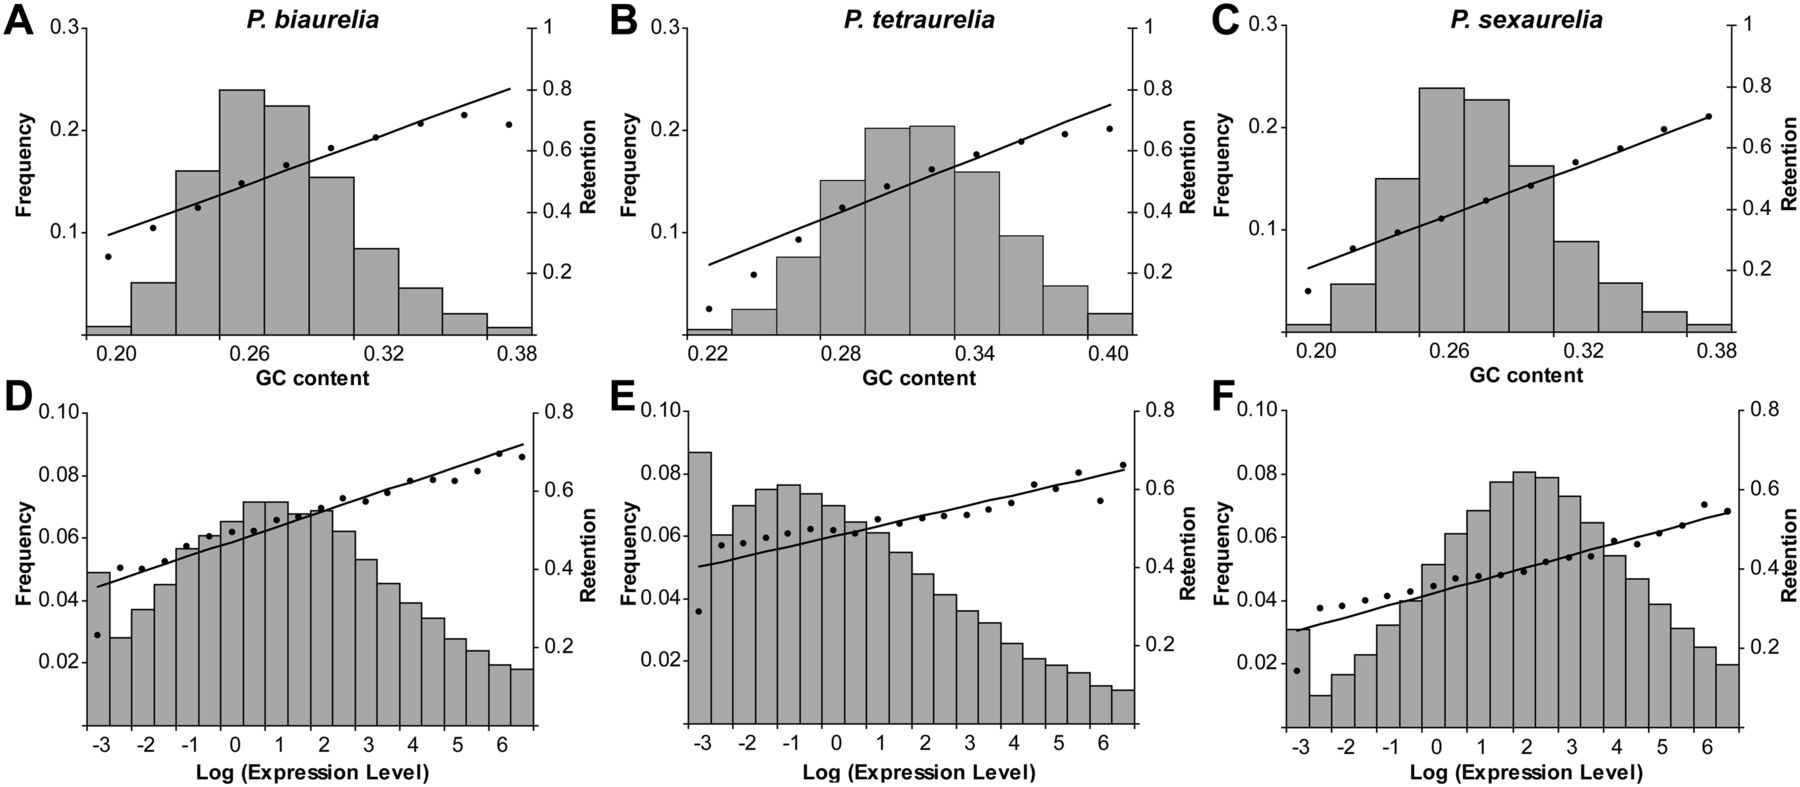
Figure 5.
Relationships between duplicate retention and GC content or expression level. GC content (A–C) and log expression level (D–F) are divided into bins. Graphs for P. biaurelia are shown in panels A and D, P. tetraurelia in panels B and E, and P. sexaurelia in panels C and F. For each species, the frequency distribution of the number of genes that fall into each GC content or expression level bin is shown (gray bars), along with the fraction of genes within each bin that are part of a duplicate pair (black dots). Weighted least-squares regression lines of retention on GC content or expression level are shown (black lines).


