
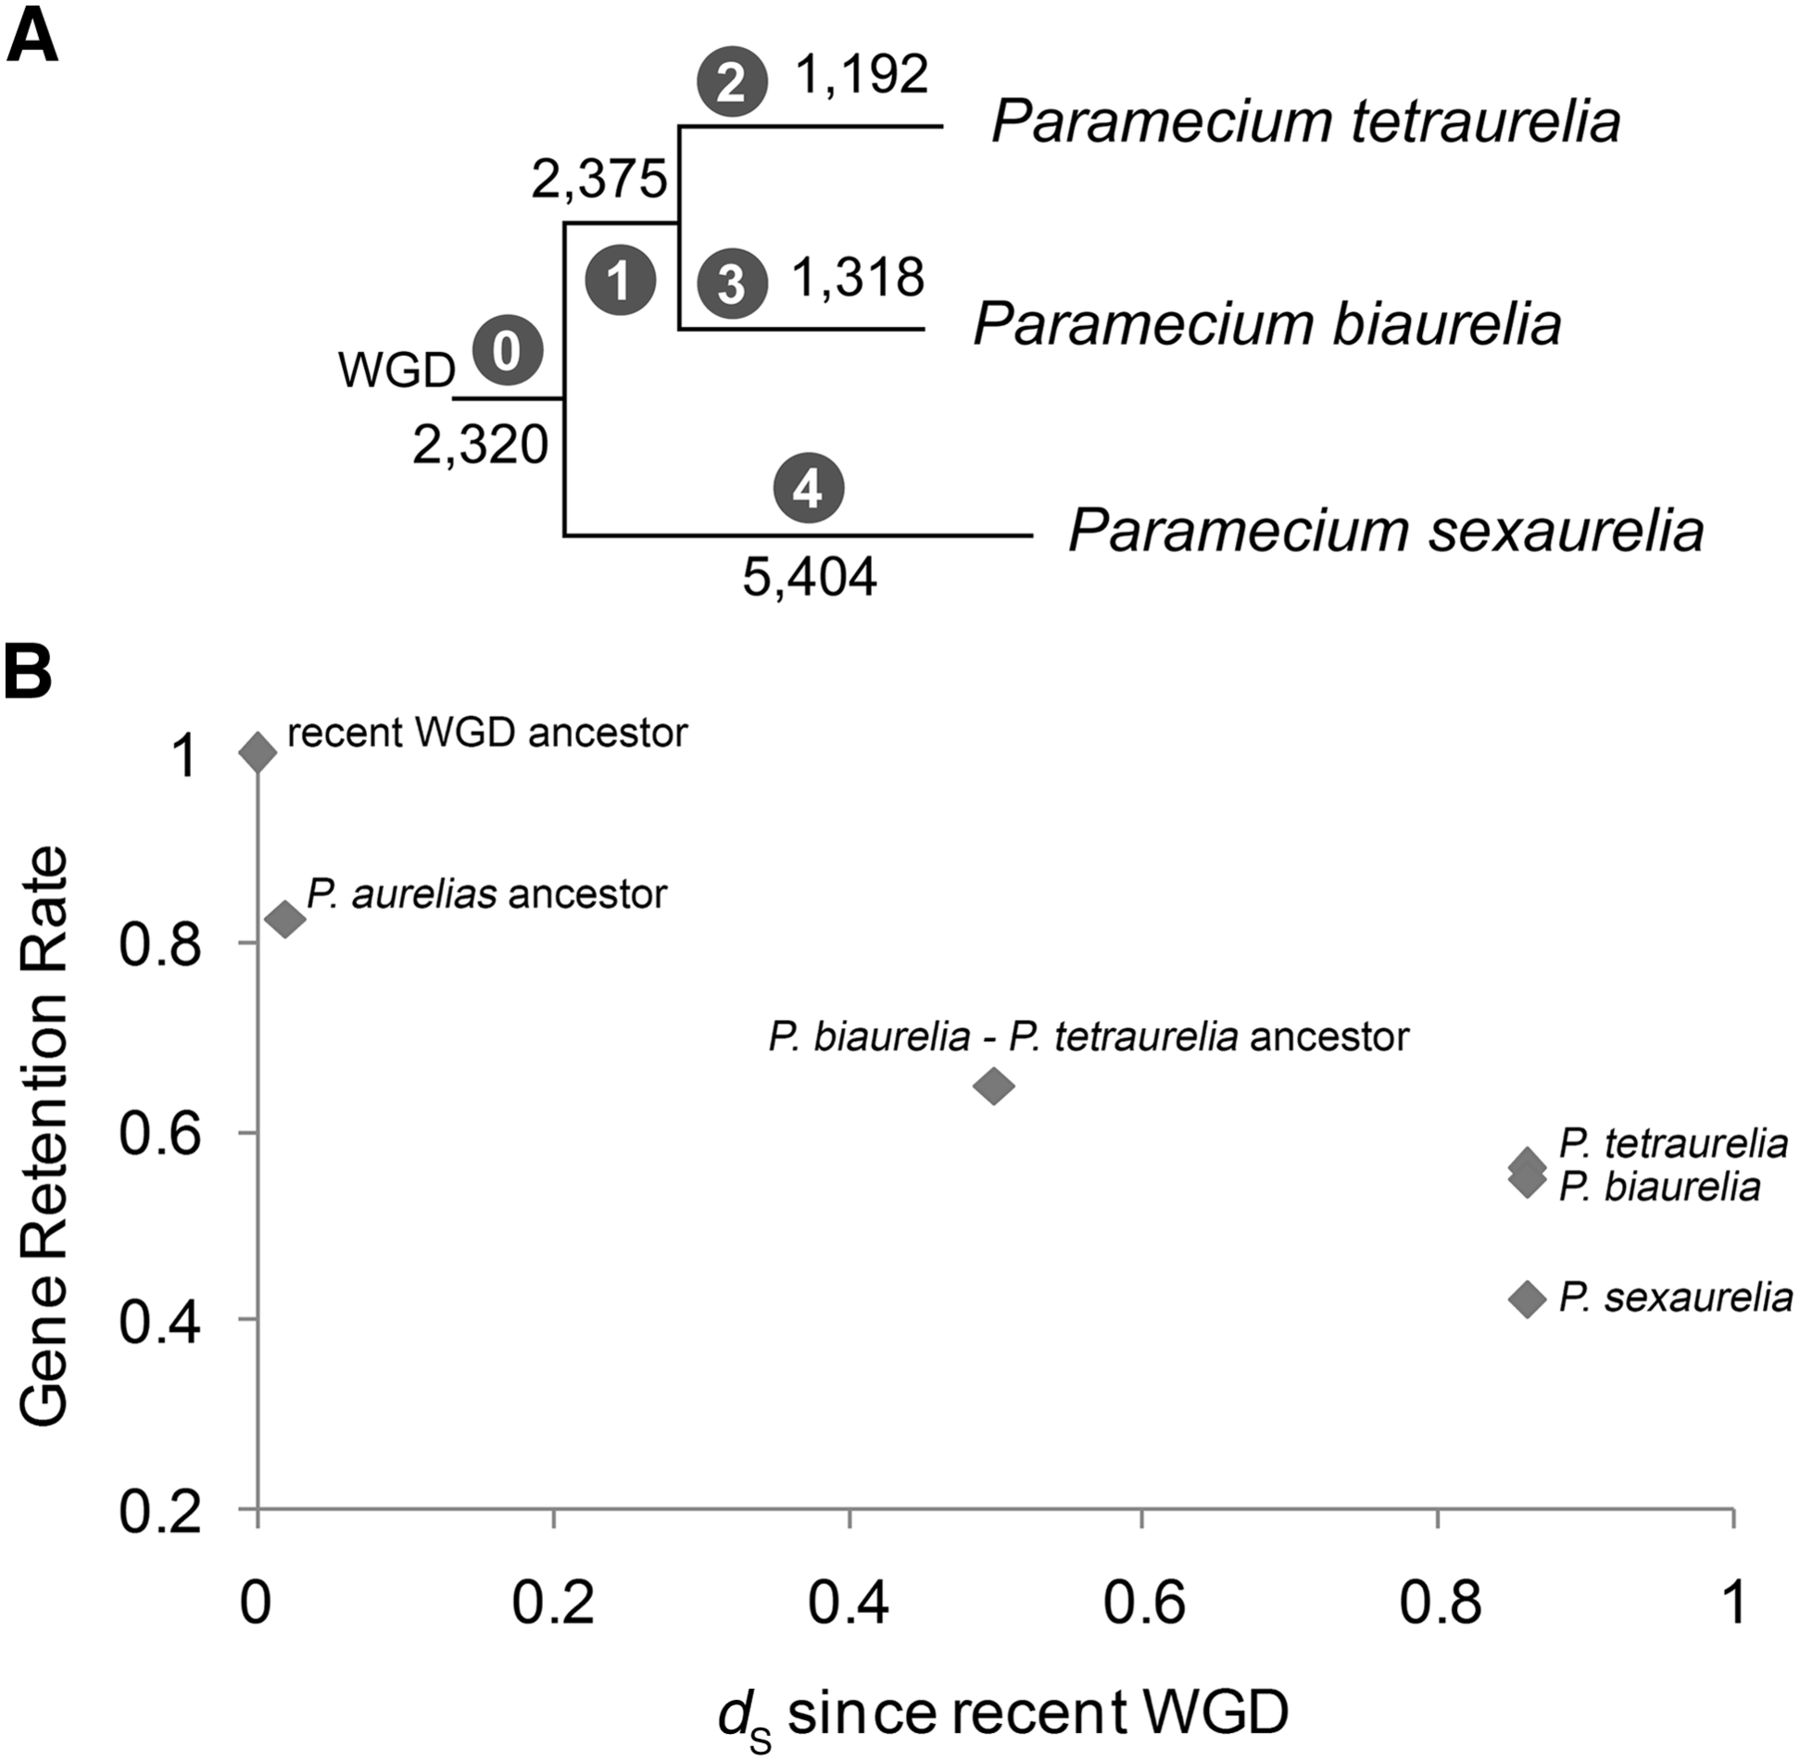
Gene losses and cumulative retention rates across the aurelia phylogeny, based on 13,408 non-solo gene families whose history can be traced from the recent WGD to extant species. (A) Phylogeny based on Figure 1. Positions of losses estimated using parsimony. Black numbers indicate the number of genes lost along each branch; numbers in circles indicate the branch labels referred to in the text. (B) Cumulative gene retention rates over time. Retention levels for extant taxa and inferred retention levels for ancestors based on the tree in A. dS since the WGD is estimated using median dS values between pairs of orthologs and paralogs (see Methods). Note that on the subset of genes used in this analysis, the retention rates for P. tetraurelia and P. biaurelia are not significantly different (0.55 vs. 0.56, respectively, P = 0.12, χ2 test).


