
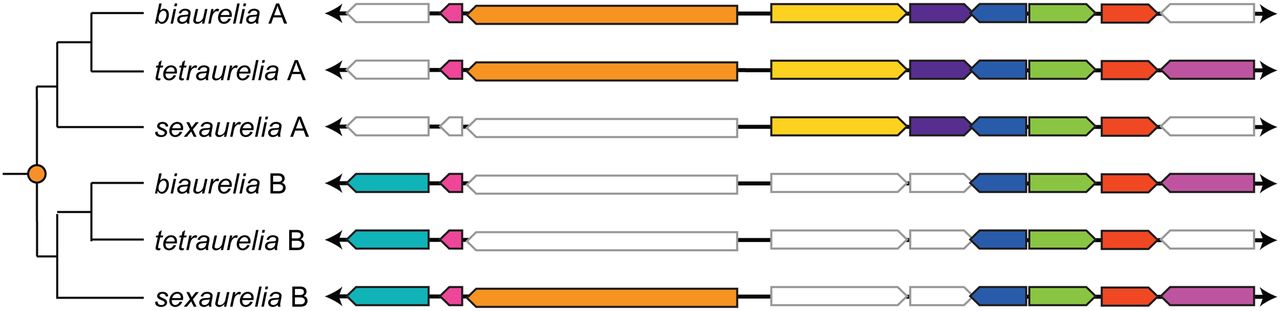
Example alignment of paralogous and orthologous scaffolds across the three aurelia species. Scaffolds designated with the same letter (A or B) are orthologous to each other. Homologous genes are displayed in matching colors, and genes that have been lost are in white with gray outlines. Sizes of intergenic regions are not to scale in order to show where gene losses have occurred. The orange dot denotes the location of the recent WGD. Regions shown are P. biaurelia A (scaffold_0033:228908–238905), P. biaurelia B (scaffold_0138:105615–111775), P. tetraurelia A (scaffold51_103:147615–158919), P. tetraurelia B (scaffold51_148:107916–119220), P. sexaurelia A (scaffold_142:121990–127294, reverse complemented), and P. sexaurelia B (scaffold_131:113584–123996).


