
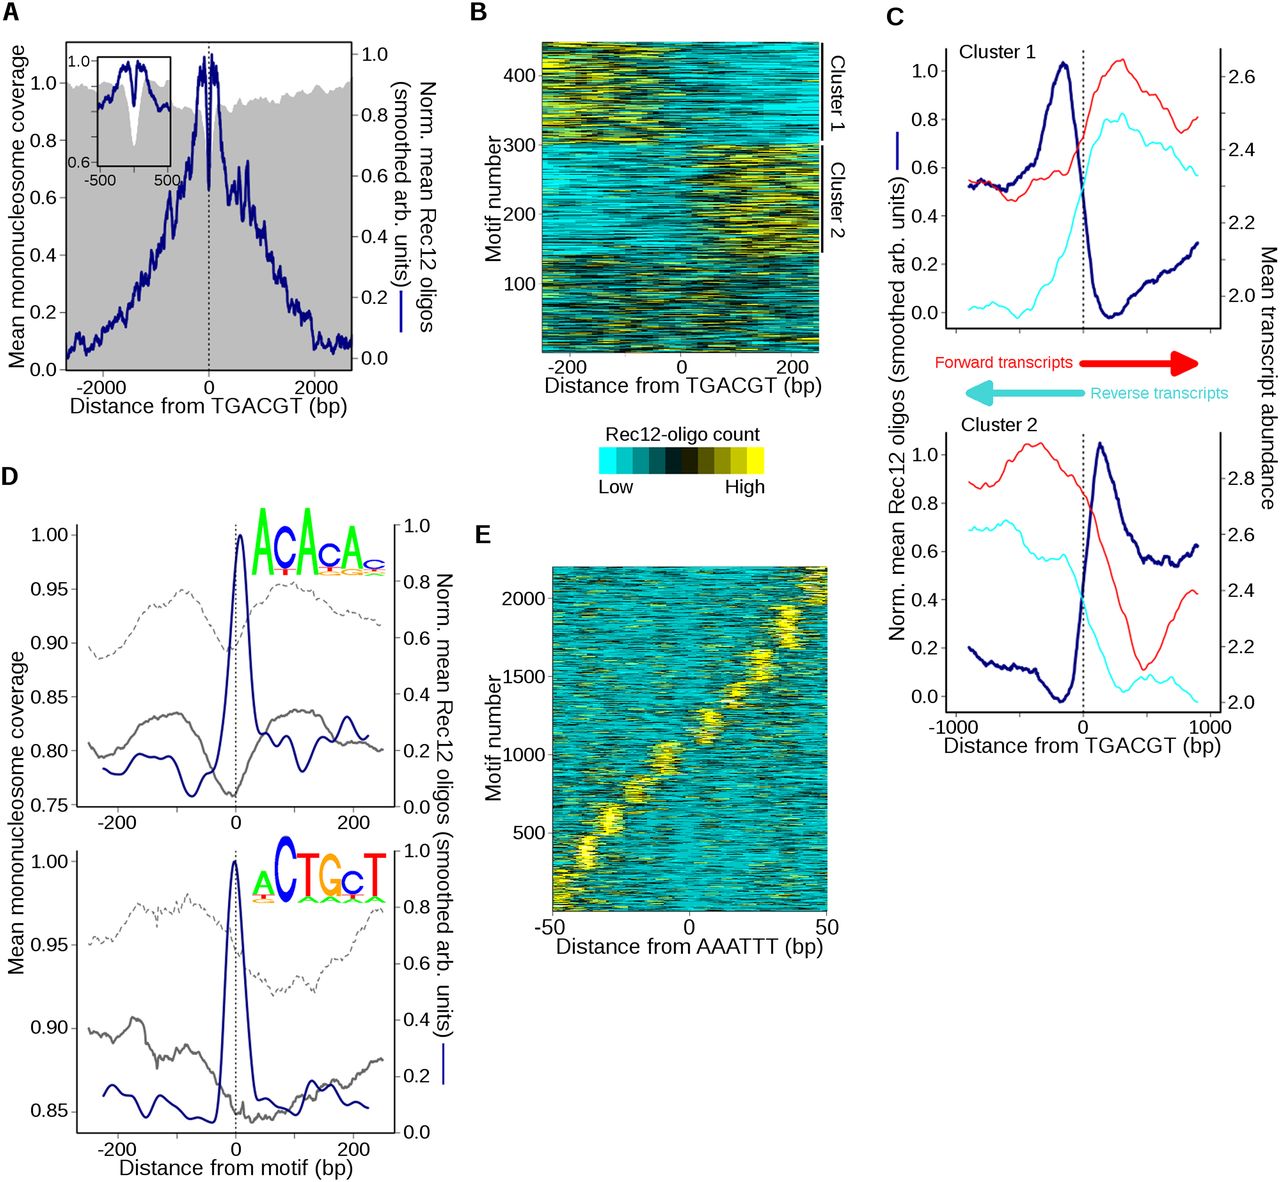
Atf1-Pcr1 and select short DNA sequence motifs are spatially correlated with DSBs. (A) Rec12-oligo distribution around Atf1-Pcr1 motifs. Sites with the motif 5′-TGACGT and ≥140 RPM total within 2 kb were oriented and aligned (n = 448). Mean normalized oligo profiles were determined as in Figure 5A and smoothed with a 51-bp Hann window for clarity (inset shows central 1 kb). (B) Atf1-Pcr1 associated oligo distributions are often asymmetric at individual sites. Oligo counts around each site in A were binned, clustered according to oligo distribution (cluster 1 loci have ≥50% more oligos to the left than to the right of the motif; cluster 2 loci have ≥50% more oligos to the right), and plotted as a heatmap. Clustering by k-means reveals a similar pattern (data not shown). (C) Transcription and Rec12 oligos predominate on opposite sides of asymmetric Atf1-Pcr1 motifs. Oligo counts in the clusters from B were averaged after normalization as in Figure 5A and compared with mean meiotic transcript abundance (red and cyan lines) (Chen et al. 2012). Oligos were smoothed with a 201-bp Hann window for clarity. (D) Rec12 oligos around simple sequence motifs. A PWM was constructed for 5′-ACACAC- and 5′-ACTGCT-like motifs (top logos), and genomic positions scoring ≥95% match to a PWM and having ≥50 oligos within the 500-bp window (n = 1021 and 1024, respectively) were identified. Averages of normalized Rec12-oligo distributions at these sites were determined as in Figure 5A and smoothed with a 51-bp Hann window (blue lines). The mean mononucleosome coverage around the aligned motifs during meiotic (solid gray lines) and mitotic (dashed gray lines) growth was then determined (Soriano et al. 2013). (E) Spatial pattern of Rec12 oligos around 5′-AAATTT motifs (n = 2200). Sites with the motif and ≥10 RPM total within 100 bp were aligned, and normalized Rec12-oligo profiles were determined as in Figure 5A. Oligo profiles were clustered by k-means (k = 10) and plotted as in B. The distance between adjacent oligo clusters is ∼10 bp; see Supplemental Figure S6F for the composite mean profile. See Supplemental Figures S5 and S6 for further analyses of sequence motifs associated with Rec12 oligos.


