
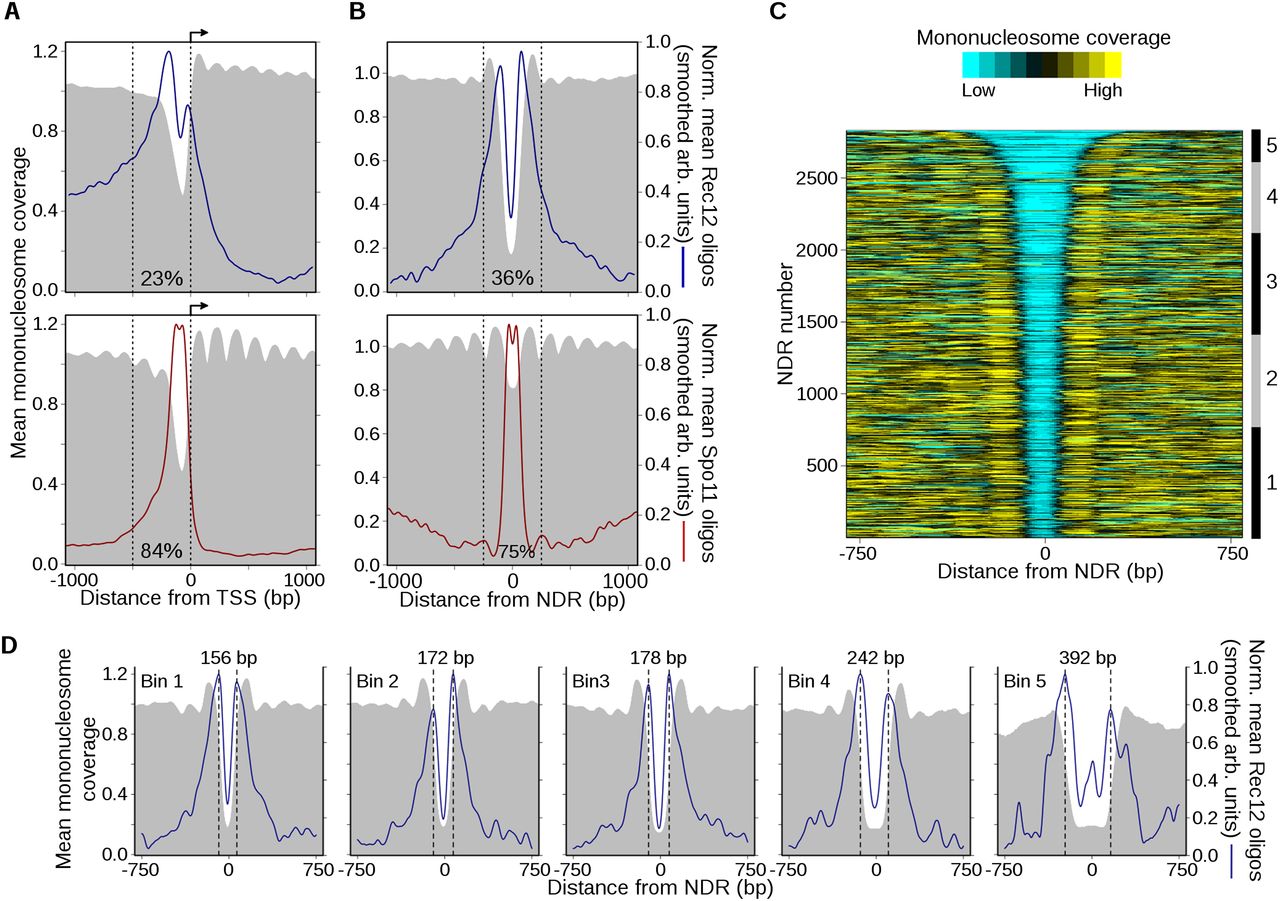
DSBs have complex relationships with local chromatin features. (A) Spatial pattern of Rec12- and Spo11-oligo formation adjacent to TSSs. Annotated TSSs in S. pombe (top) and S. cerevisiae (bottom) were aligned and oriented with transcription to the right (arrow). The mean mononucleosome coverage (Pan et al. 2011; Soriano et al. 2013) around the TSSs was determined as in Figure 4C. To determine the average spatial relationship between DSBs and TSSs, oligo counts around individual TSSs were divided by the total oligos in the 2-kb region plotted, then these normalized profiles were averaged across all TSSs and smoothed with a 101-bp Hann window for clarity. Normalization prevents sites with many oligos from dominating the average profile. Note that this procedure reveals the average shape of the Rec12- and Spo11-oligo distributions, not the average intensity. The fraction of total Rec12 or Spo11 oligos found within 500 bp upstream of TSSs (dashed lines) is indicated. (B) Rec12-oligo profiles are strongly patterned around NDRs. The midpoints of NDRs in S. pombe (constitutive and meiosis-specific) (Soriano et al. 2013) and S. cerevisiae (Jiang and Pugh 2009) were aligned and the mean normalized oligo profiles were determined as in A. The fraction of total Rec12 or Spo11 oligos found within 500 bp of NDRs (dashed lines) is indicated. Additional data are in Supplemental Figure S4. (C) Heatmap of mononucleosome occupancy around S. pombe NDRs. The NDRs from B (top) were ranked by width and the degree of mononucleosome coverage was determined around each site. The coverage profiles were smoothed for clarity and plotted on a color scale (top). NDRs were binned based upon their width for subsequent analysis (right ruler; bin 1, ≤174 bp; bin 2, 175–199 bp; bin 3, 200–249 bp; bin 4, 250–349 bp; bin 5, ≥350 bp). (D) Rec12 oligos are biased toward NDR boundaries and the flanking nucleosomes, not NDR centers. The NDRs within each bin in C were aligned and mean normalized profiles were calculated as in A. The distance between the maxima in the Rec12-oligo peaks in each bin (dashed lines) is indicated at the top. The mean width of NDRs in bin 1 is 162 bp; bin 2, 187 bp; bin 3, 221 bp; bin 4, 287 bp; bin 5, 458 bp.


