
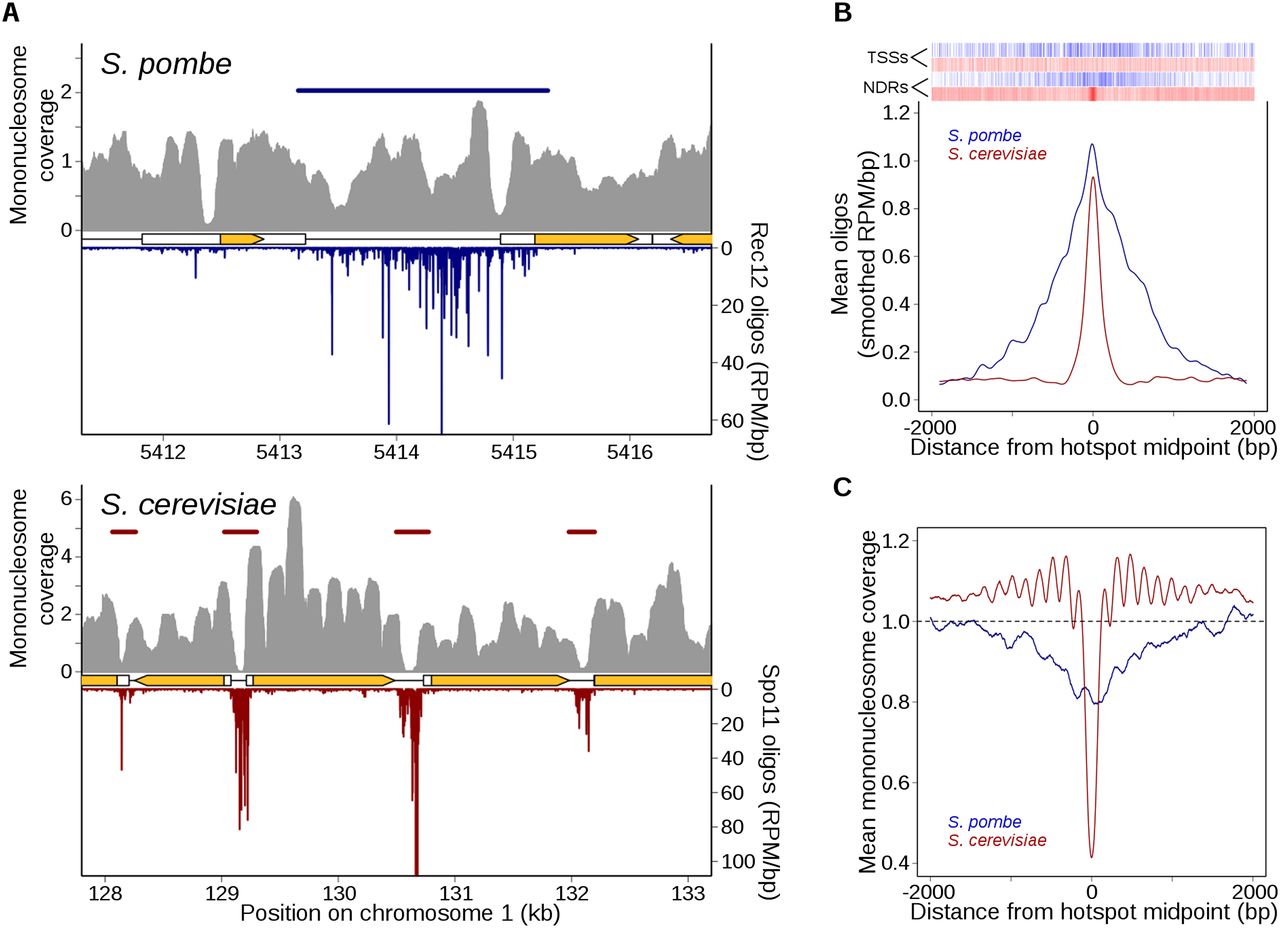
Markedly different relationship between DSBs and chromatin structure in S. pombe and S. cerevisiae. (A) Rec12 oligos are not especially enriched in NDRs, unlike Spo11 oligos. High-resolution mononucleosome coverage maps (MNase-seq) from meiotic S. pombe (Soriano et al. 2013) and S. cerevisiae (Pan et al. 2011) cells were compared with their respective oligo maps for representative regions on each organism’s chromosome 1. Nucleosome maps were normalized by taking the number of times each base pair was sequenced and dividing it by the mean genome coverage (i.e., the mean genome coverage is 1). Horizontal blue and red bars indicate hotspots. Orange arrows mark protein-coding genes and white boxes indicate transcripts. (B) Fission yeast hotspots are much wider than budding yeast hotspots and not generally centered on TSSs or NDRs. Rec12- and Spo11-oligo hotspot midpoints were aligned and the mean oligo distributions were smoothed with a 201-bp Hann window. Relative positions of annotated meiotic NDRs (Soriano et al. 2013) and TSSs (Lantermann et al. 2010) in S. pombe are indicated by blue ticks at top; S. cerevisiae NDRs and TSSs (Jiang and Pugh 2009) are in red. (C) Unlike Spo11-oligo hotspots, Rec12-oligo hotspots tend not to be strongly MNase sensitive in meiotic chromatin. Hotspots were aligned as in B and the mean mononucleosome coverage was determined at each position.


