
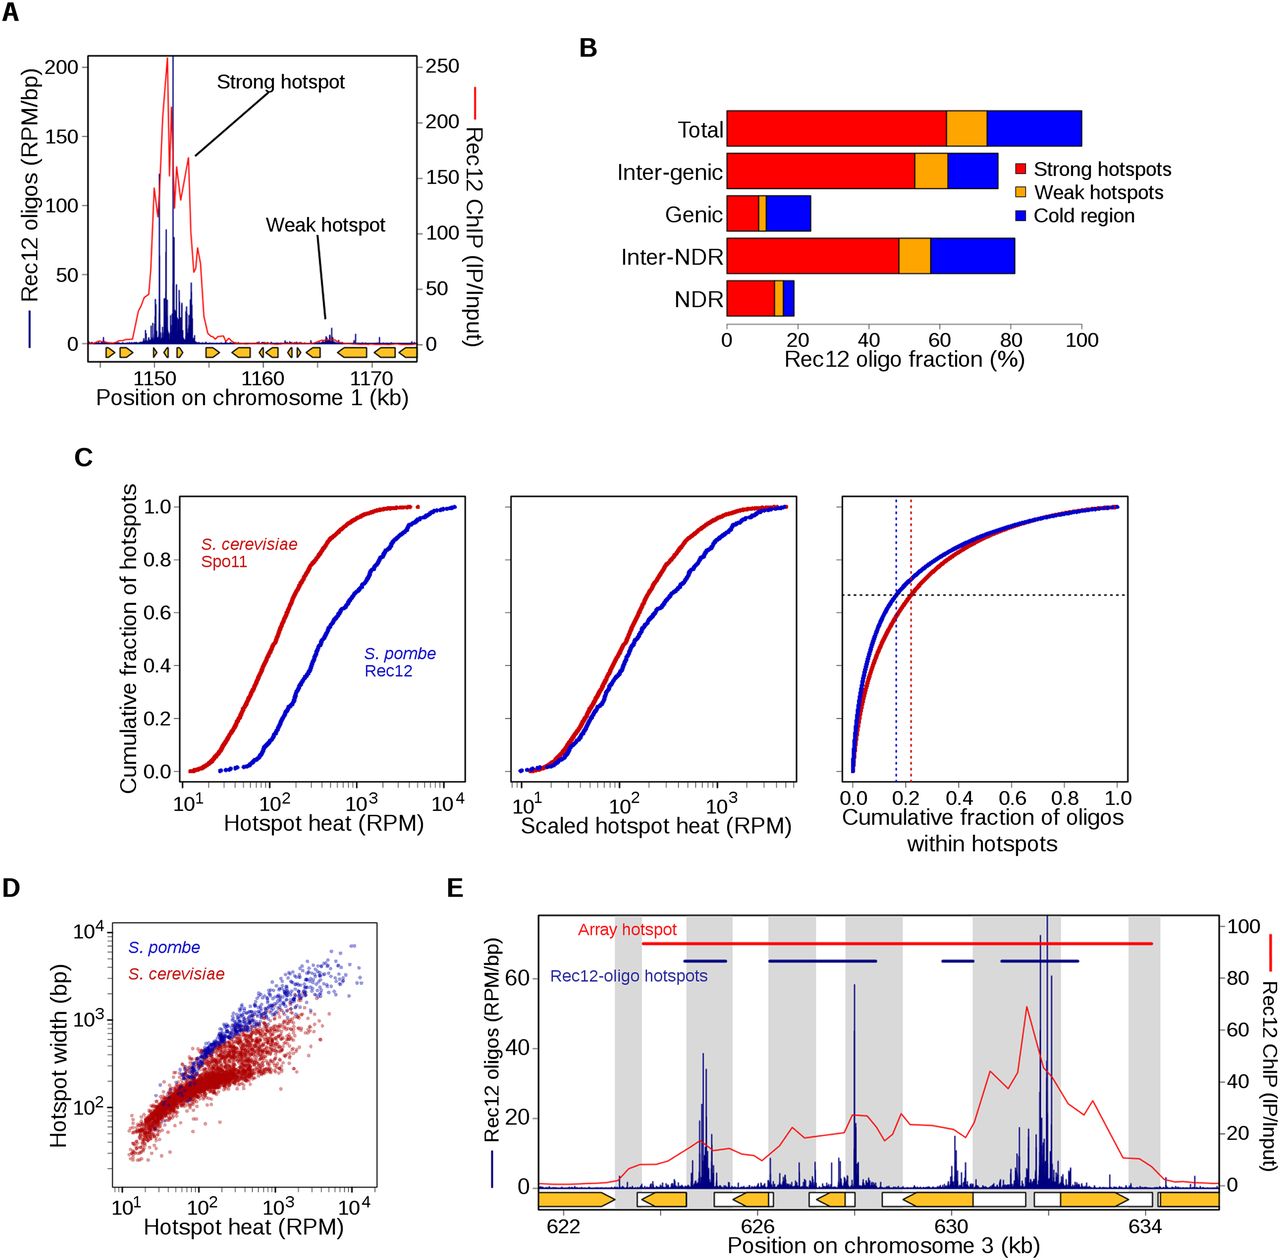
Features of DSB hotspots and comparisons with S. cerevisiae. (A) An example of adjacent strong and weak hotspots. “Strong” hotspots refer to those with an inferred break frequency of ≥0.3% of DNA, i.e., the limit of detection in prior studies. Rec12-oligo frequencies (blue) were compared with Rec12 ChIP-chip signal (red). For comparison, there are eight strong and 13 weak hotspots in Figure 1B (top). Orange arrows indicate open reading frames of protein-coding genes. (B) Rec12 oligos arise primarily from intergenic DNA and hotspots, although about a quarter arise from “cold regions,” i.e., outside the 603 hotspots defined here. NDR and Inter-NDR indicate the fraction of oligos that arise within or outside nucleosome depleted regions, respectively. (C) Rec12-oligo counts in hotspots follow a smooth continuum. (Left) Hotspots were rank-ordered by oligo counts (603 hotspots from S. pombe; 3604 hotspots from S. cerevisiae) (Pan et al. 2011). (Middle) To account for the greater number of meiotic DSBs per cell in S. cerevisiae, the rank-ordered S. pombe hotspots were scaled by a factor of 58/160, the approximate ratio of the number of DSBs per cell in S. pombe and S. cerevisiae. (Right) Plot of the cumulative fraction of hotspot oligos among the ranked hotspots. (D) Hotter hotspots tend to be wider than colder hotspots; S. pombe hotspots tend to be much wider than in S. cerevisiae. (E) Hotspot boundaries correlate poorly if at all with IGR boundaries, positions of protein-coding genes (orange arrows), or promotors (white boxes indicate transcribed regions). Gray bands indicate IGRs. Top bars show the defined hotspot regions, blue from this study and red from microarray hybridizations (Fowler et al. 2013). See Supplemental Figure S2 for further analyses of Rec12-oligo hotspots.


