
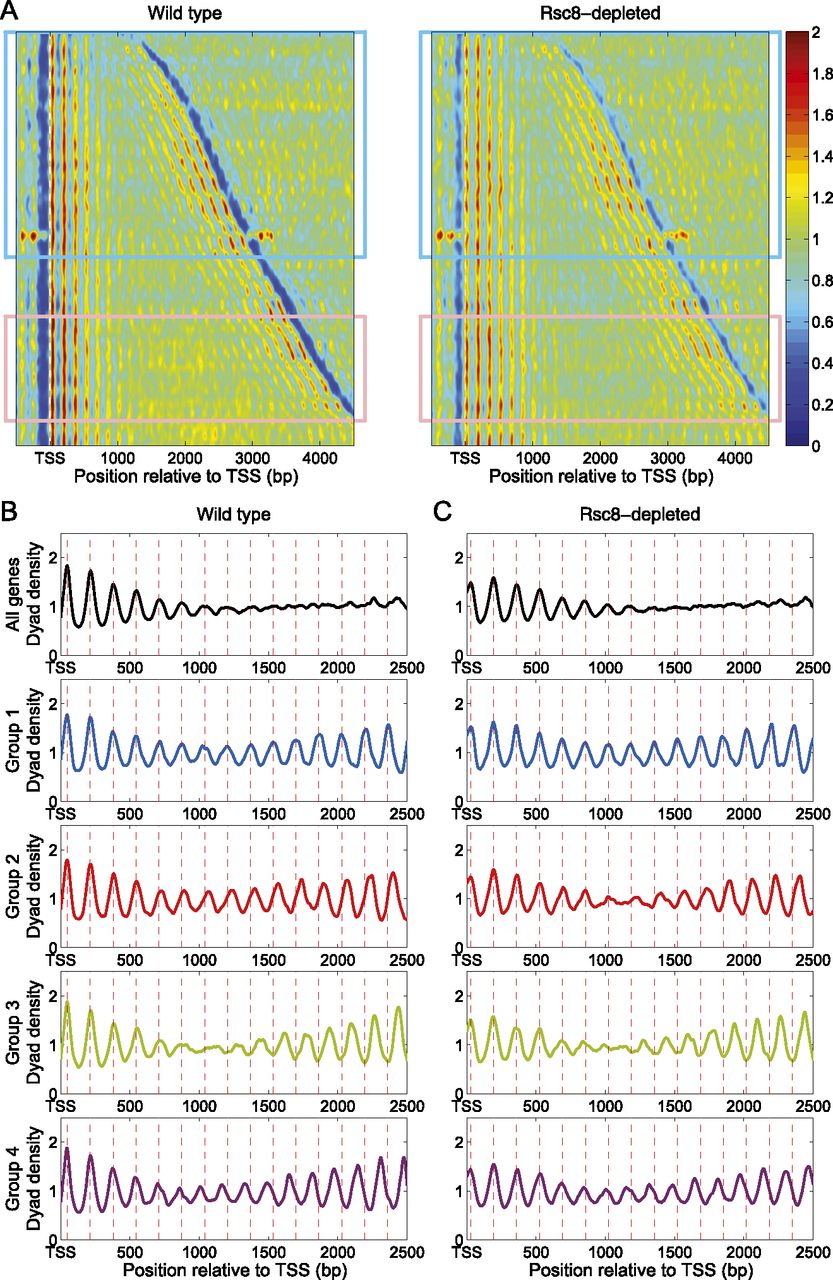
Phase interference analysis of convergent gene pairs. (A) Heat maps representing pairs of convergent genes with inter-TSS distances <5 kb, in wild-type and Rsc8-depleted cells. Gene pairs containing potential phasing elements (replication origins [ARSs], centromeres, LTRs, snRNA genes, snoRNA genes, and tRNA genes) were removed from the list. Gene pairs were sorted by inter-TSS distance. Heat maps were smoothed with a 2D symmetric Gaussian filter with standard deviation σ = 15. Rectangles denote convergent gene pairs with inter-TSS distance <3 kb (blue rectangle) and between 3.5 and 4.5 kb (pink rectangle). (B,C) Interference patterns for convergent gene pairs with inter-TSS distances <3 kb (blue rectangle in A). Top panels show the average for all of these convergent gene pairs. The lower four panels correspond to four phase groups 1–4, representing gene pairs with phase differences of 0 (in phase), 40, 80 (almost exactly out of phase), and 120 bp, respectively (all ±20 bp). (B) Wild type. (C) Rsc8-depleted cells. Note that the four groups contain different genes because of the nucleosome shifts into the NDR represented by the value of Δ (Fig. 7A). The average dyad plots were smoothed using a moving average filter with a span of 51 bp.


