
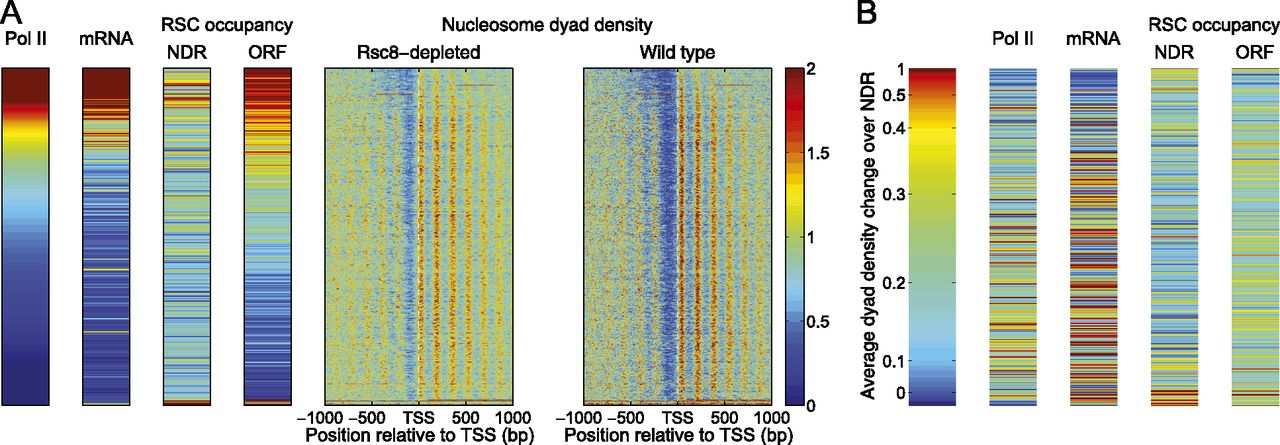
Preferential binding of RSC to heavily transcribed coding regions. (A) Correlation between Pol II density and RSC binding to coding regions. Genes were sorted according to their average ChIP signal for the CTD of Pol II over the transcription unit (left panel) (data from Elfving et al. 2014), such that the genes with the highest Pol II density are at the top. Expression data (Holstege et al. 1998), RSC occupancy data (ChIP for TAP-tagged Rsc8) at NDRs or coding regions (Floer et al. 2010), and our nucleosome dyad phasing data for wild-type and Rsc8-depleted cells are plotted in the same gene order. (B) Rsc8 depletion has the strongest effect on the NDRs of weakly transcribed genes. Genes were sorted according to increase in average NDR dyad density in Rsc8-depleted cells relative to wild type, such that the most affected genes are at the top (sorted as in Fig. 3A). Pol II density, expression data, and RSC occupancy data for the NDR and coding regions are plotted in the same gene order. Heat maps and plots were smoothed as described in the legend to Figure 3.


