
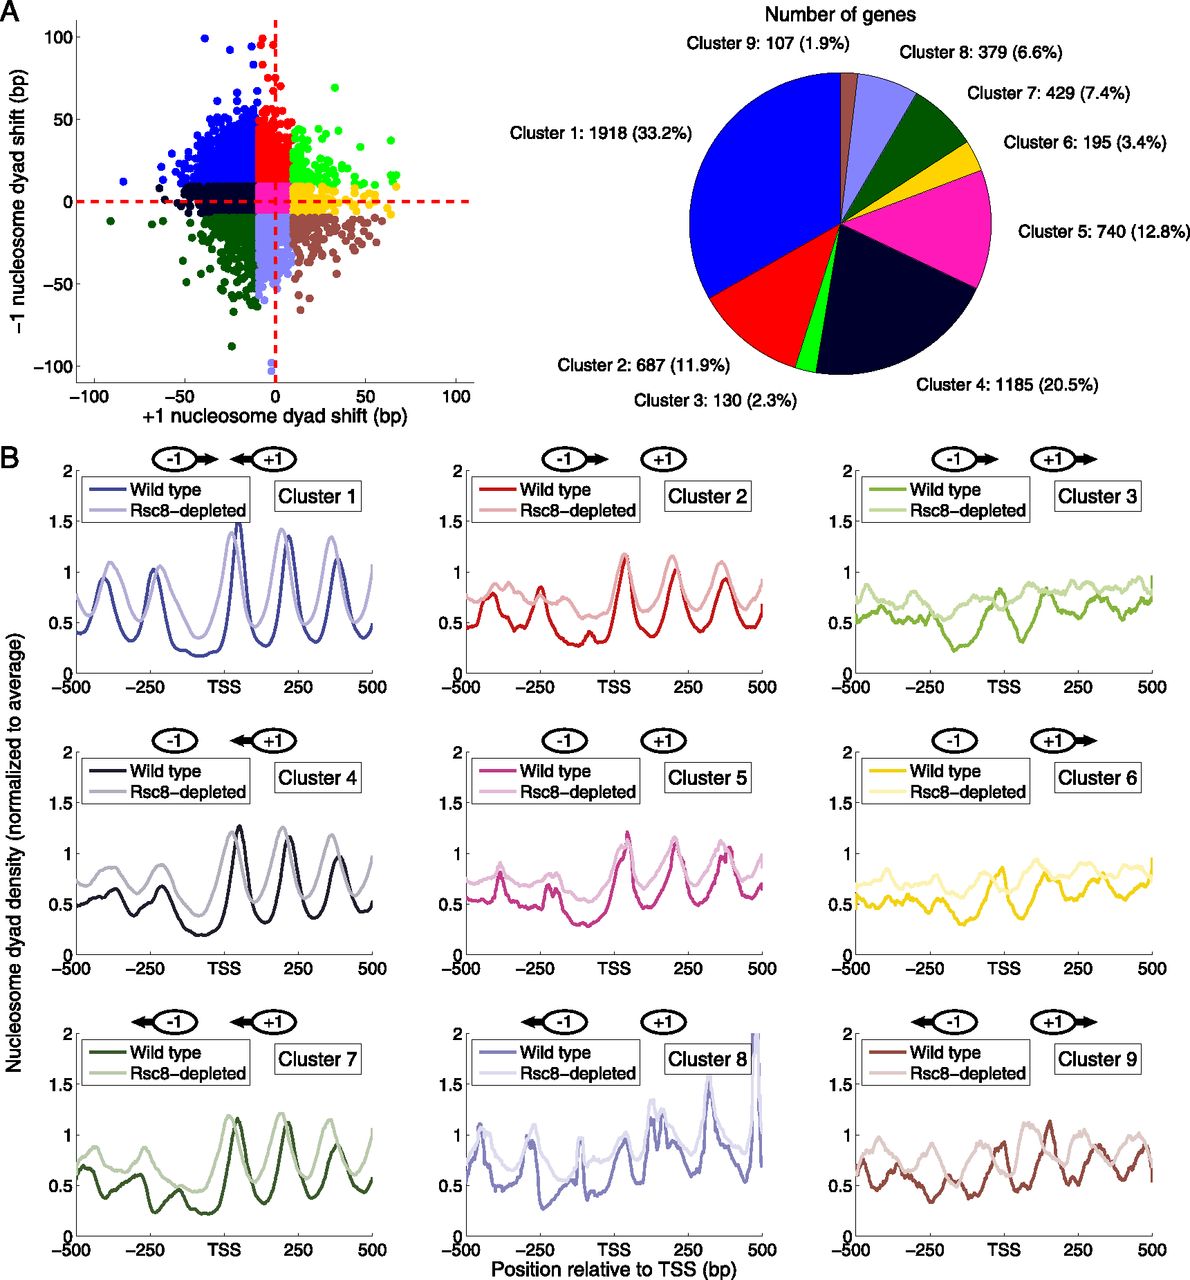
Different classes of altered chromatin structure in Rsc8-depleted cells. (A) Scatter plot representing the shift in the +1 nucleosome dyad versus the shift in the −1 nucleosome dyad for each gene in Rsc8-depleted cells relative to wild type. A negative shift indicates an upstream movement of the nucleosome in Rsc8-depleted cells. The genes are color-coded to define nine clusters of genes, according to whether the +1 and −1 nucleosomes shift upstream or downstream, or remain in place (shift <10 bp). The pie chart indicates the fraction and number of genes in each cluster. (B) Average nucleosome dyad density profiles in a 1-kb window centered on the TSS for each of the nine gene clusters defined in A. The profiles were smoothed using a moving average filter with a span of 21 bp. The cartoon at the top of each panel indicates the direction of displacement of the +1 and −1 nucleosomes.


