
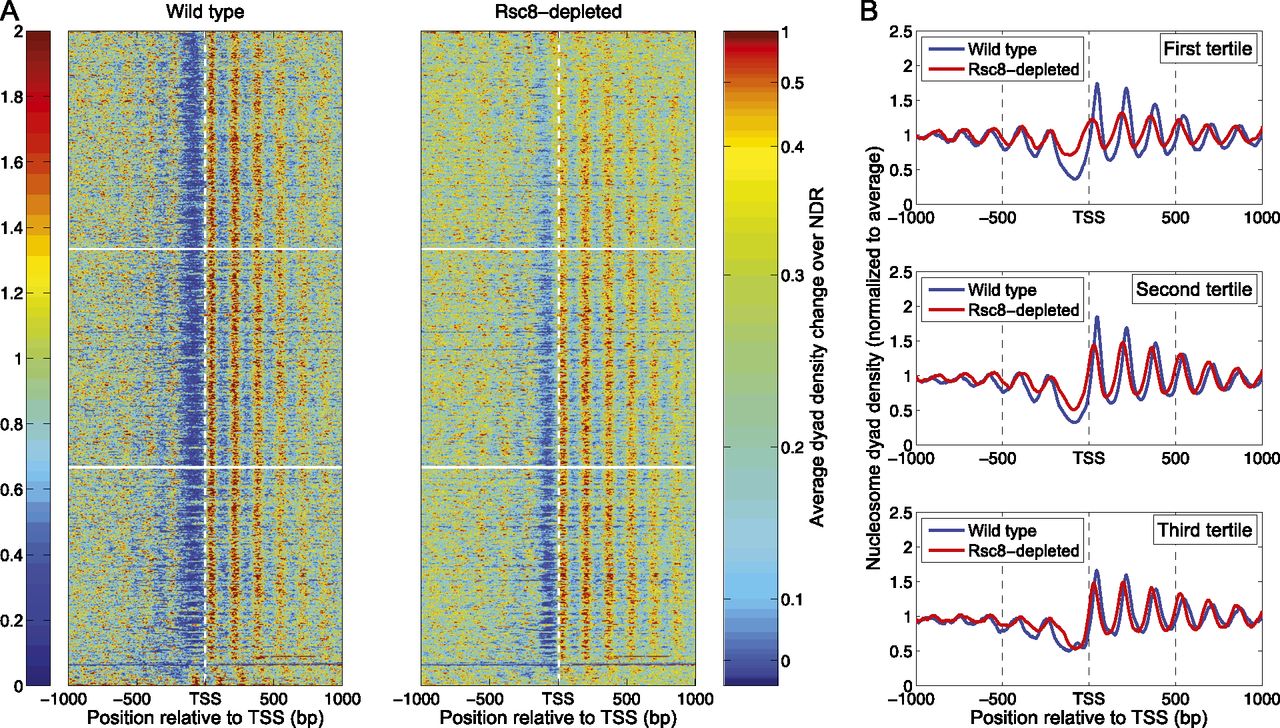
Rsc8 depletion results in a general increase in nucleosome density at the NDR. (A) Heat map analysis of all genes, sorted for change in NDR occupancy. The heat maps show the nucleosome dyad distributions in a 2-kb window centered on the TSS. Each row represents a gene. The genes were sorted according to the average change in dyad density in the NDR, which was defined as the region from −150 to −50 relative to the TSS (right color bar). Genes displaying the largest increase in nucleosome dyad density in the NDRs of Rsc8-depleted cells relative to wild type are at the top. The heat maps were smoothed with a 2D symmetric Gaussian filter with standard deviation σ = 3, the color plot representing the average dyad density change was smoothed using a moving average filter with a span of 21 genes. (B) Average nucleosome dyad density profiles for the top, central, and bottom gene tertiles, delimited by the white horizontal lines in A. The plots were smoothed using a moving average filter with a span of 21 bp.


