
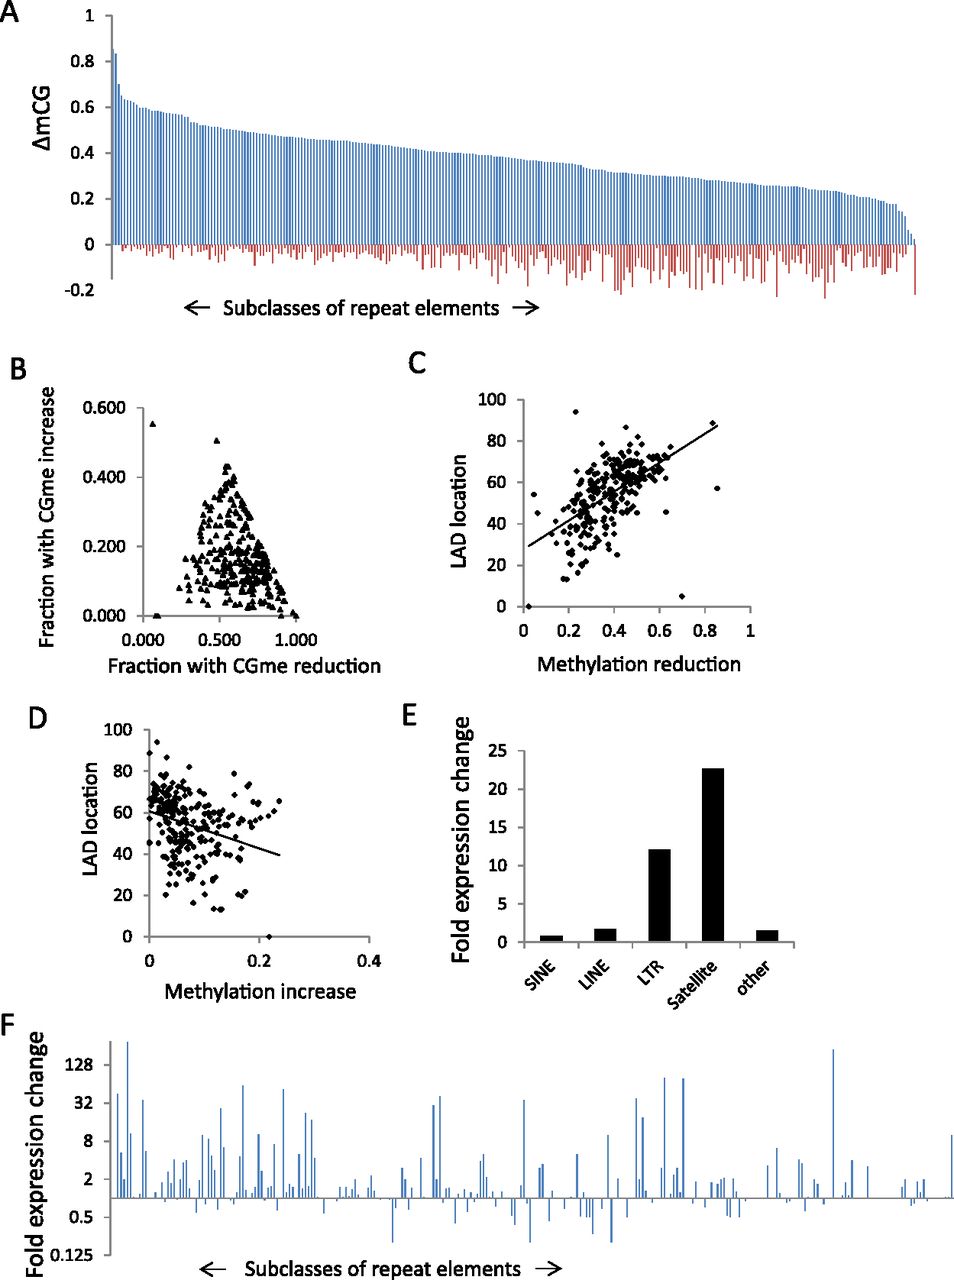
De-repression of specific repeat subclasses in KO MEFs. (A) Bar graph representing CG methylation changes (WT methylation values minus KO methylation values) as ΔmCG for 270 repeat subclasses. The repeat classes are sorted based on CG methylation decreases (blue) in KO MEFs compared to WT MEFs. The CG methylation increases in KO MEFs are represented as minus values (red). A list of ranked repeat sequences is compiled in Supplemental Table S2. A bar graph of distinct subfamilies is presented in Supplemental Figure S8. (B) Scatterplot representing the fraction of repeat sequences within a subclass that shows methylation reduction (x-axis) and CG methylation increase (y-axis). All 270 subclasses are presented. (C,D) Scatterplot showing the DNA methylation reduction at repeat classes (C) or the DNA methylation increases (D) and the percentage of sequences within the subclass that is located in LADs. A list of repeat sequences and their frequency of LAD location is compiled in Supplemental Table S2. (E) Bar graph representing repeat element gene expression as fold changes of KO over WT levels (log2) of different repeat superfamilies (Supplemental Table S2). (F) Bar graph representing gene expression changes in KO MEFs over WT MEFs for all 270 repeat subclasses. The repeat classes are sorted as in A. A bar graph of distinct subfamilies is presented in Supplemental Figure S8.


