
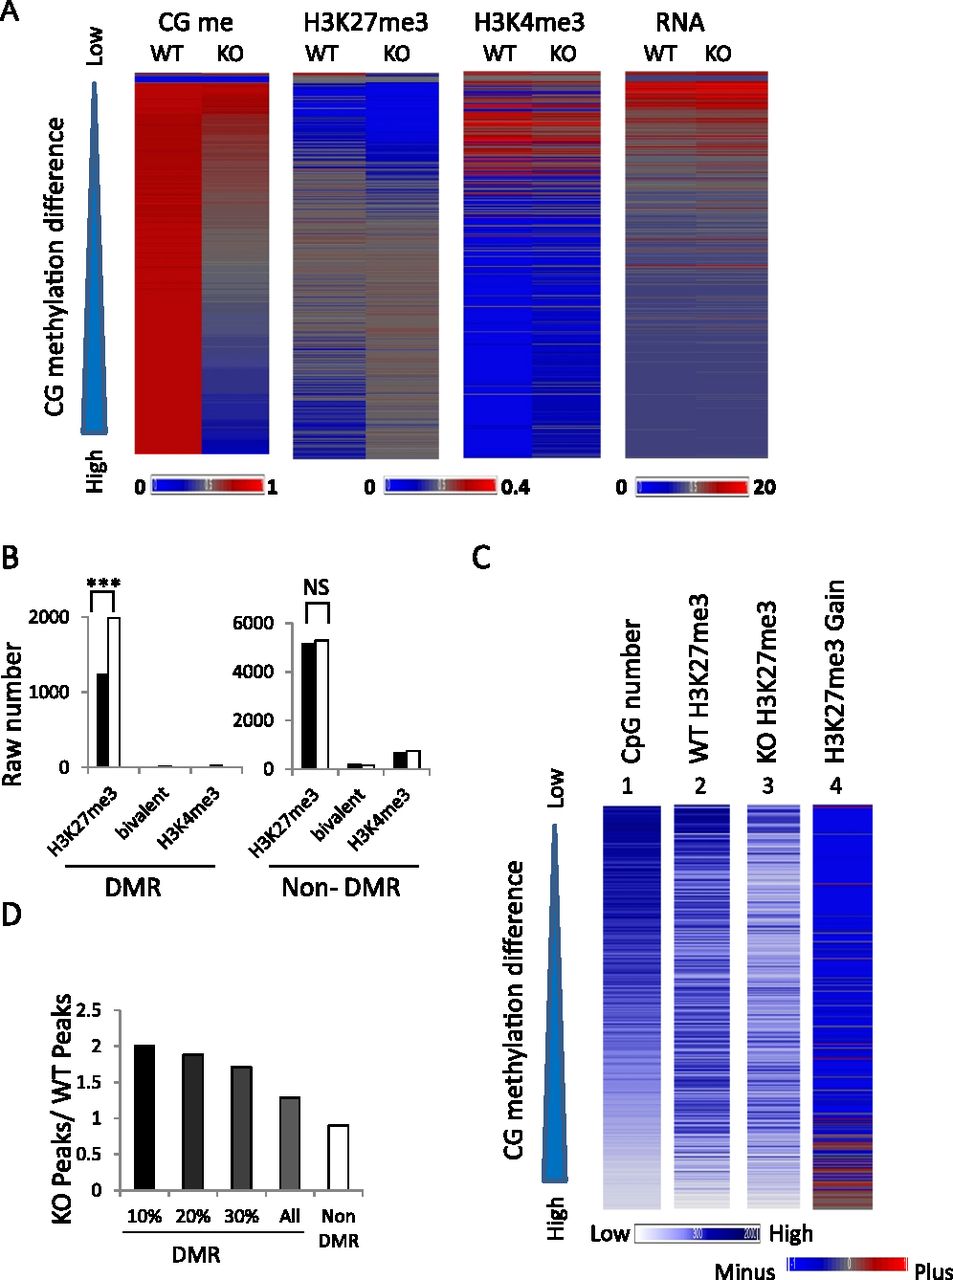
Increased H3K27me3 at CG hypomethylated regions. (A) Heatmap of CG methylation, H3K27me3, H3K4me3, and RNA-seq signal intensities at 5-kb tiles for chromosome 1 comparing WT and KO MEFs. The tiles (n = 38,840) are ranked based on CG methylation differences (WT values minus KO values). (Left) The ranking is presented from low (top) to high (bottom) (triangle). Biological replicates of H3K27me3 signals are presented in Supplemental Figure S6. (B) Bar graph presenting the raw number of 5-kb tiles with H3K27me3 modifications, H3K4me3, or bivalent modification in WT (black) and KO (white) MEFs in differential methylated regions (DMRs) and nondifferential methylated regions (non-DMR) on chr1. (***) The exact Pearson χ2 tests were applied. P < 0.001. (C) Heatmap presentation of mean signal intensities at promoter regions (2 kb upstream of and 2 kb downstream from TSSs) of protein-coding genes (n = 23,350). Genes are ranked based on CG methylation differences (WT minus KO MEFs) from low to high (top to bottom) (triangle). (1) Number of CpG sites located within promoter regions, (2) H3K27me3 signal intensities in WT MEFs, (3) H3K27me3 signal intensities in KO MEFs, and (4) difference in H3K27me3 modifications (KO values minus WT values). (Bottom left) The blue color scale represents signal intensities for panels 1, 2, and 3. (Bottom right) The blue/red color scale represents the difference of H3K27me3 values (KO values minus WT values) in panel 4. (D) Bar graph presenting the ratio of promoters marked by H3K27me3 in KO MEFs over the number of promoters marked by H3K27me3 in WT MEFs. The promoters have been grouped based on their CG methylation levels and fall into DMRs (n = 3794) or non-DMRs (n = 19,202). In addition, they are grouped as the top 10% DMR promoters (n = 379), 20% DMR (n = 758), and 30% (n = 1137).


