
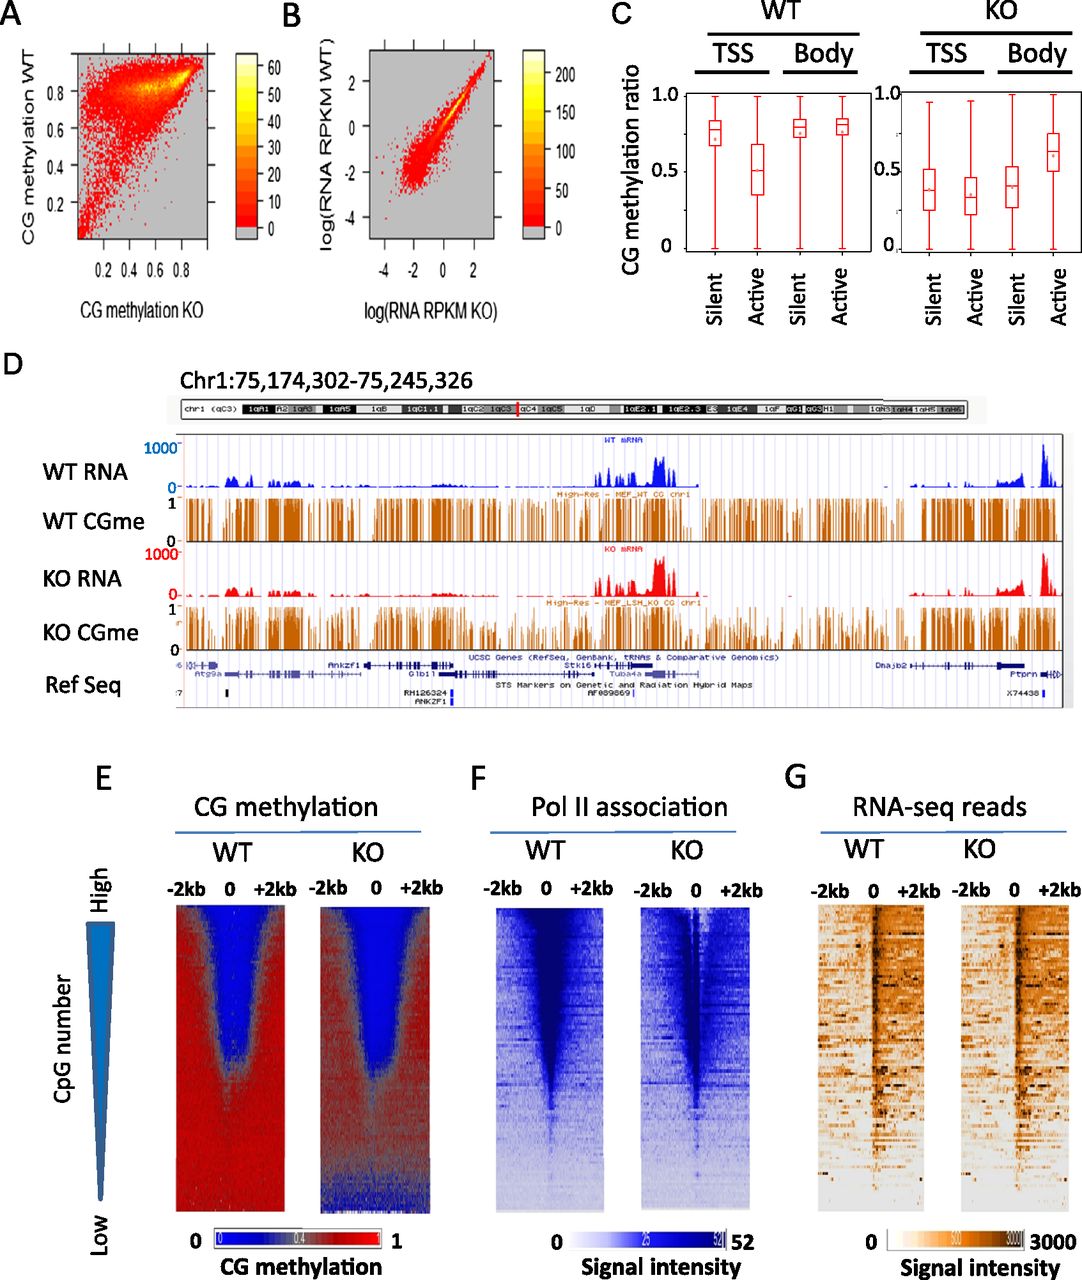
Relationship between relative transcript abundance levels and Pol II at CG hypomethylated promoters in KO MEFs. (A) Heatmap scatterplot analysis presenting the mean values of promoter CG methylation (2 kb upstream of and downstream from the TSS) in WT MEFs and KO MEFs. (B) Heatmap scatterplot analysis representing relative transcript abundance level as read coverage (RPKM values) of RNA-seq analysis comparing WT and KO MEFs. Results of biological replicates are shown in Supplemental Figure S2. (C) Box plot representing mean CG methylation values at gene bodies or TSSs (2 kb upstream of and 2 kb downstream from the TSSs) classified in groups of genes with transcripts (active) and without any detectable transcripts (silent) (Wilcoxon rank test, P < 0.0001). (D) Genome browser view illustrating CG methylation (brown) and transcript abundance level (RPKM values) at representative genes comparing WT (blue) and KO MEFs (red). (E–G) Promoters of protein-coding genes (n = 23,350) are ranked based on the presence of CpG numbers (represented by the triangle to the left). (Bottom) Genes with low CpG density; (top) genes with high CpG density. Heatmap presentation for CG methylation values at 1-bp resolution (E), Pol II ChIP signal intensities at 5-bp resolution (F), and RNA-seq signal intensities at 5-bp resolution (G) around the TSSs and 2 kb of flanking regions for WT MEFs and KO MEFs. Genes are arranged into 100 groups and mean values were computed for each genomic position.


