
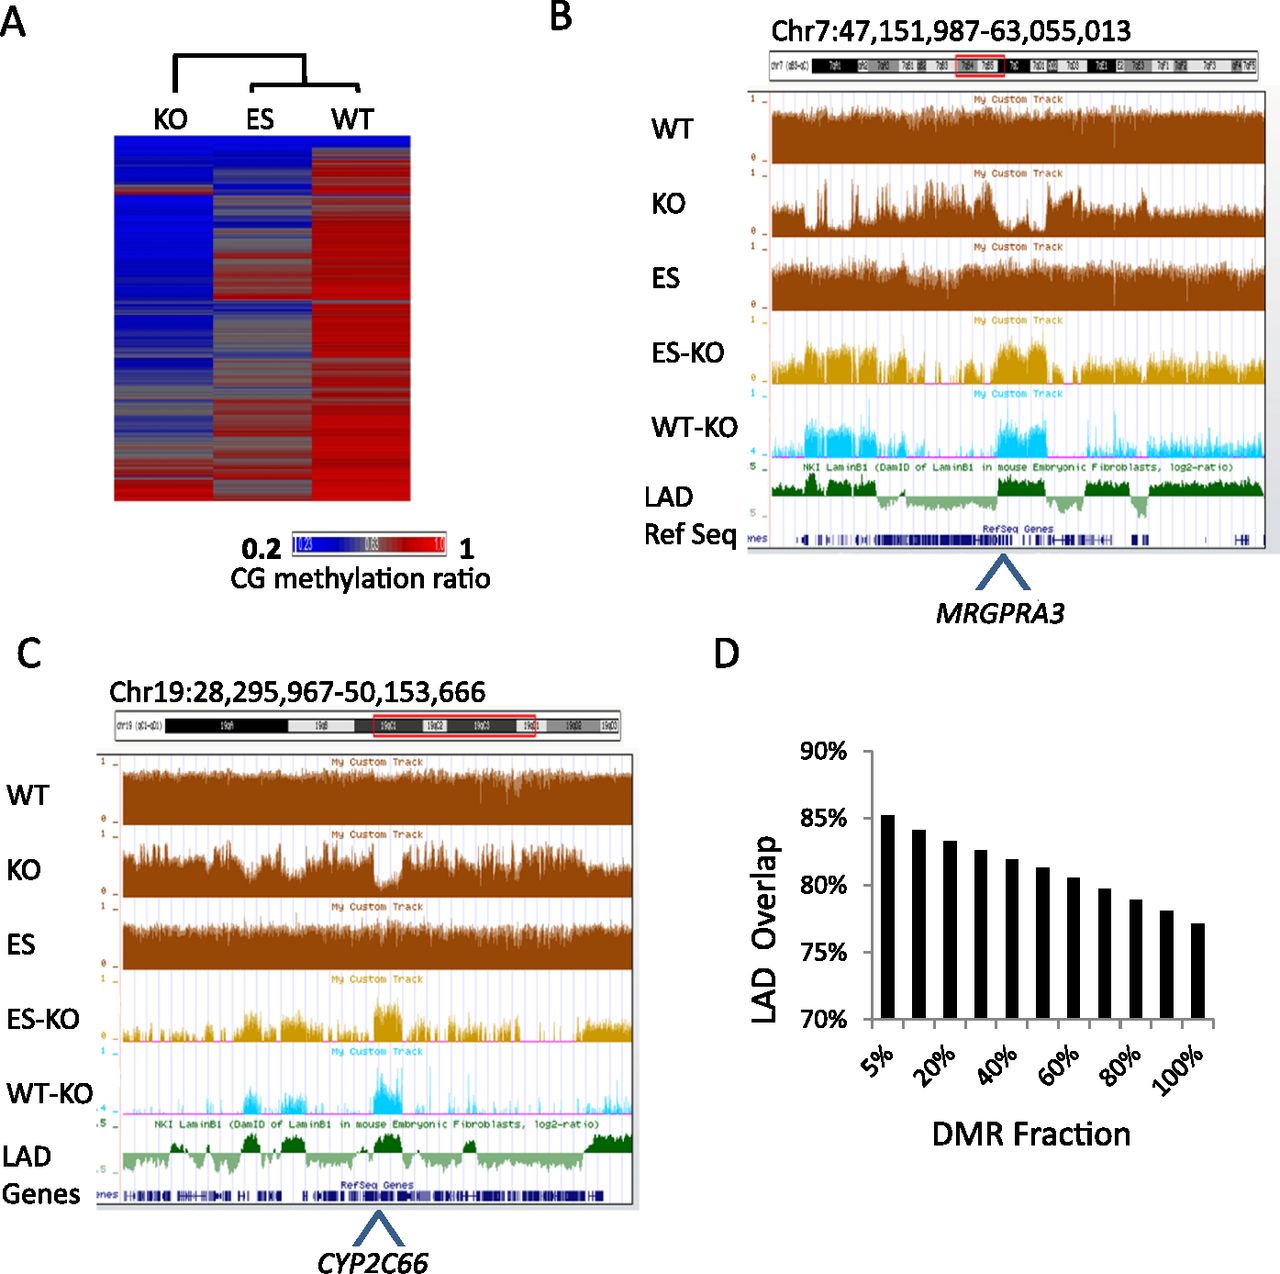
Chromosomal domains with reduced CG methylation in KO MEFs. (A) Heatmap of CG methylation levels at 5-kb tiles for chromosome 1 of KO MEFs, WT MEFs, and ES cells. The rows were sorted by complete linkage hierarchical clustering with Euclidian distance as a distance measure. (B,C) Genome browser views illustrating CG methylation (mean values of 5-kb tiles) at the Cyp2 (B) and Mrgpra (C) gene clusters, comparing WT MEFs, KO MEFs, and ES cells (brown). The lower panels display differentially methylated regions (DMRs) at 5-kb tiles of ES minus KO (light brown) and WT minus KO (difference >0.4; light blue) compared to lamin B1 (LMNB1) attachment regions (green). (D) Bar graph displaying percent overlap of differentially methylated regions (DMR) with lamin B1 (LMNB1) attachment regions (P < 0.0001). The DMR is ranked based on the degree of CG methylation difference with the top 5% displaying the greatest CG methylation difference between the WT and KO MEFs.


