
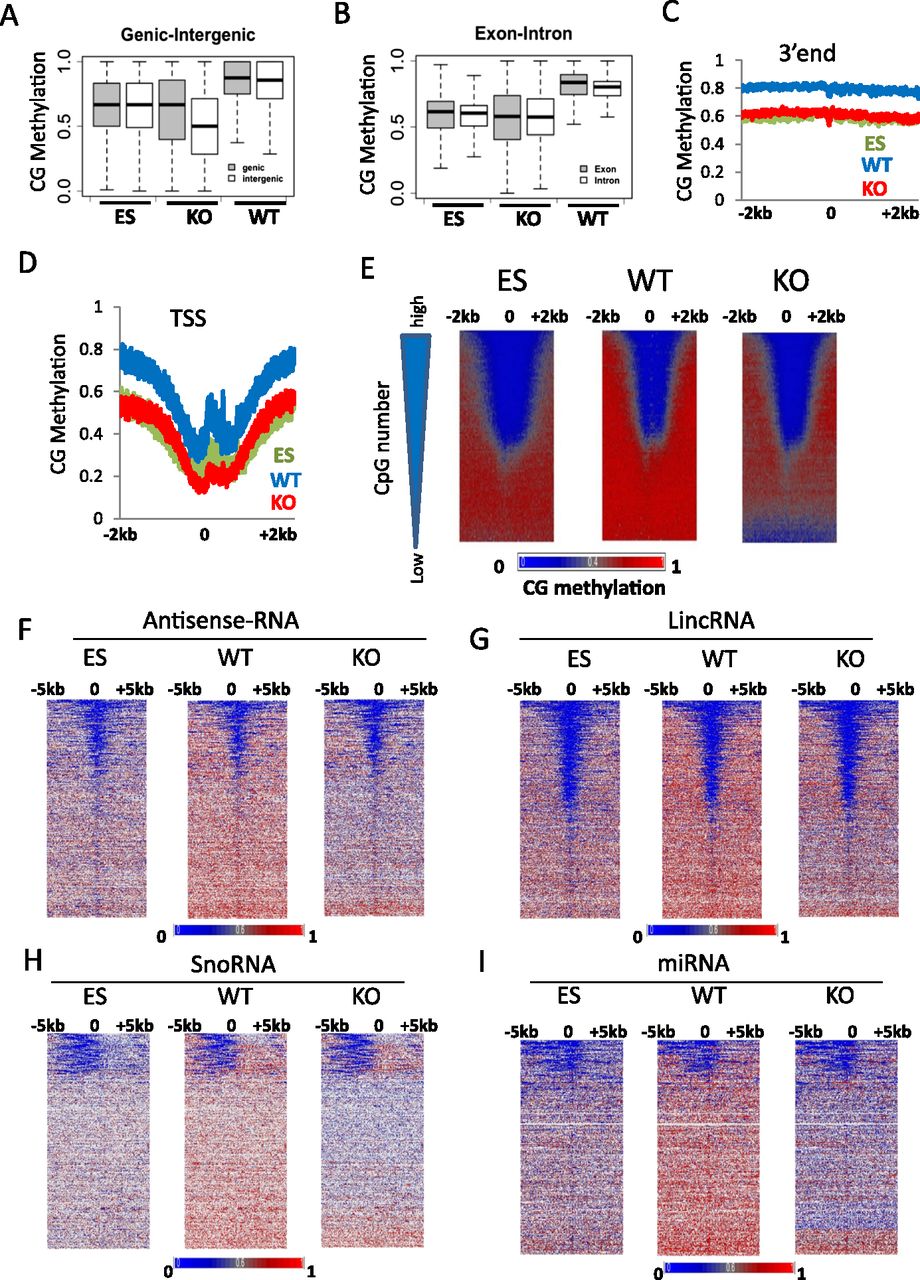
CG methylation changes at protein-coding genes and noncoding RNA genes. (A) CG methylation values for genic (shaded) and intergenic (white) regions. First, the fraction of methylation was determined for a single cytosine in the CG context (methylated cytosine/over the number of sequence reads covering the single cytosine site). Then mean methylation values were computed for all cytosines located within a gene (shaded) or within a region between two genes (white). The plot represents the distribution of methylation values for single genes (shaded) and single intergenic regions (white). The differences of the average methylation values comparing WT and KO genic and intergenic regions are highly significant (Wilcoxon signed-rank test, P < 0.0001). (B) CG methylation values for exons (shaded) and introns (white) were assessed as in A. The differences of the mean methylation values comparing WT and KO genic and intergenic regions are highly significant (Wilcoxon signed-rank test, P < 0.0001). (C,D) Average distribution of CG methylation values at transcriptional termination sites (3′end; C) and over transcriptional start sites (TSSs; D) of protein-coding genes (n = 23,350) and 2 kb of flanking regions. (E) CG methylation at promoters of protein-coding genes. Genes (n = 23,350) are ranked based on CpG numbers (triangle at the left of the panel). Promoters with the lowest CpG density are at the bottom (low) and with the highest CpG number at the top (high). Heatmap presentation of CG methylation profiles in KO MEFs, WT MEFs, and ES cells. CG methylation distribution is shown at 1-bp resolution around TSSs and 2 kb of upstream and downstream flanking sequences (horizontal axis). Genes are arranged into 100 groups, and mean values computed (vertical axis). (F–I) Heatmap of CG methylation distribution at 1-bp resolution around transcription start sites of noncoding RNA genes comprising a region 5 kb upstream and 5 kb downstream, including antisense-RNA (F), and lincRNA (long intergenic noncoding RNA; G), and snoRNA (small nucleolar RNA; H), and miRNA (micro RNA; I). Genes are ranked based on mean CG methylation values in WT MEFs.


