
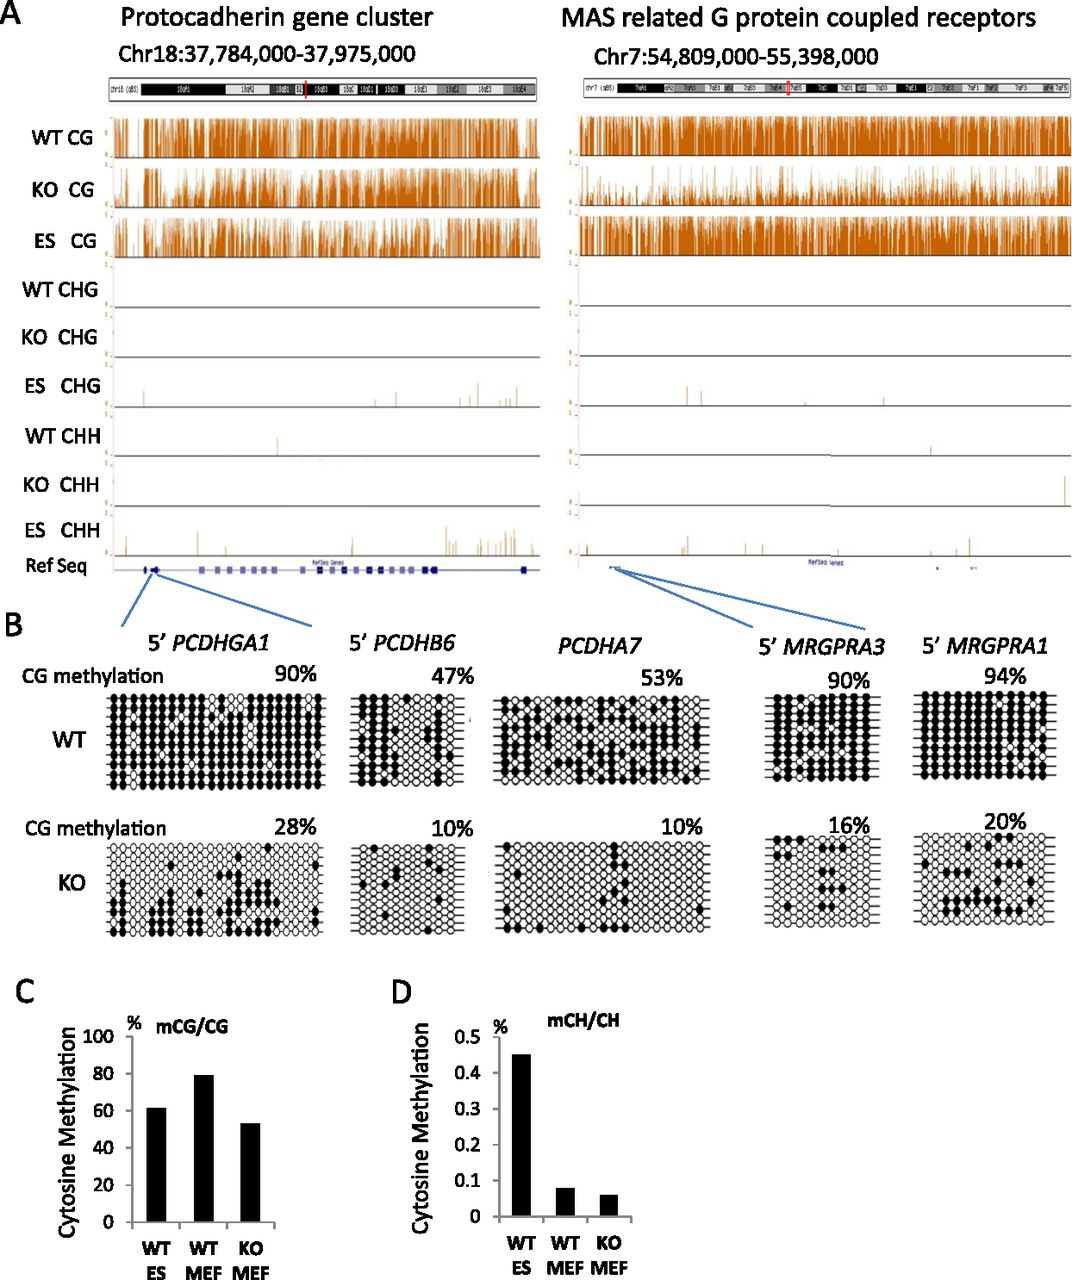
Global CG methylation reduction. (A) Genome browser view presenting CG methylation values (methylated CG/CG representing methylated cytosine over the number of sequence reads covering the CG site) as a fraction of 1 (with 1 indicating 100% methylation at a given site) and CHH (methylated CHH/CHH) and CHG methylation (methylated CHG/CHG) comparing KO (Hells−/−) of primary murine embryonic fibroblasts (MEFs), wild-type (WT) MEFs, and WT embryonic stem cells (ES). (B) Bisulfite sequencing analysis of several loci comparing WT MEFs and KO MEFs to validate results of whole-genome bisulfite sequencing. Additional validations are shown in Supplemental Figure S1. The black circle represents a methylated cytosine; the open circle, an unmethylated cytosine. (C,D) Global mean CG methylation values (C) and CH methylation values (D) in KO MEFs, WT MEFs, and ES cells. First, the fraction of methylation was determined for a single cytosine in the CG or CH context (methylated cytosine/over the number of sequence reads covering the single cytosine site). Then, mean methylation values were computed based on all cytosines assessed in the genome (a value of 0.8 equals 80%). The differences of the mean methylation values are highly significant (Wilcoxon signed-rank test, P < 0.0001).


